Full Report
The numbers behind Salesforce, Inc.: as-reported financial statements and company metrics for FY2022–FY2026, traced to the source filings, opened with the share-price history those statements have to justify. Every linked figure opens the exact page of the filing it was printed on, with the statement row highlighted. Amounts in US$ millions unless noted.
Reading notes: Fiscal year ends January 31; e.g. FY2026 covers the year ended January 31, 2026. Filename vs. filing offset: the corpus PDF annual_reports/CRM_annual_report_FY2022 is in fact Salesforce's FY2023 Form 10-K (latest income column is fiscal 2023), and annual_reports/CRM_annual_report_FY2024 is the FY2024 10-K (a duplicate is stored as CRM_annual_report_FY2023). Fiscal years were mapped by each filing's own latest reported column, not by the filename. There is no standalone FY2022 10-K in the corpus, so FY2022 figures are cited to the FY2023 10-K, where they appear as the comparative column. FY2022 income statement and cash flow are cited to the FY2023 Form 10-K comparative columns; FY2022 balance sheet is the January 31, 2022 comparative column of that same filing. Revenue by service offering: the company renamed 'Data' to 'Integration and Analytics' in Q4 FY2024, and in the FY2026 10-K prefixed each offering with 'Agentforce' (e.g. 'Agentforce Sales'); the underlying values are continuous across the renamings, so each row uses a stable label while the verbatim quotes preserve the printed names.
Share Price — Full Available History — 22 Years
The stock closed at $170.77 on Jul 17, 2026 — up 15,786% over the window shown (+25.8% a year), trading between $0.60 and $367.87. At that close the stock trades at 22× FY2026 diluted EPS as reported below.
Source: market price feed, monthly closes, sampled from 5,552 source observations, Jun 2004–Jul 2026. Price return only, excludes dividends. Prices are split-adjusted (1:4 on Apr 18, 2013).
FY2026 at a Glance
Revenue (US$ millions)
Net income (US$ millions)
Diluted EPS
Source: FY2026 consolidated statements [1] [2] [3] [4]. Click any linked figure to open the filing page with the row highlighted.
Revenue by Service Offering
| Revenue by Service Offering | FY2022 | FY2023 | FY2024 | FY2025 | FY2026 |
|---|---|---|---|---|---|
| Sales | 5,989 | 6,831 | 7,580 | 8,322 | 9,028 |
| Service | 6,474 | 7,369 | 8,245 | 9,054 | 9,818 |
| Platform and Other | 4,509 | 5,967 | 6,611 | 7,247 | 8,882 |
| Marketing and Commerce | 3,902 | 4,516 | 4,912 | 5,281 | 5,428 |
| Integration and Analytics | 3,783 | 4,338 | 5,189 | 5,775 | 6,232 |
| Total subscription and support | 24,657 | 29,021 | 32,537 | 35,679 | 39,388 |
| Professional services and other | 1,835 | 2,331 | 2,320 | 2,216 | 2,137 |
| Total revenues | 26,492 | 31,352 | 34,857 | 37,895 | 41,525 |
| Total revenues growth, derived | — | +18.3% | +11.2% | +8.7% | +9.6% |
Source: Note 2. Revenues — Disaggregation of Revenue (Subscription and support by service offering); income statement for revenue totals [5] [1] [6] [2]. Click any linked figure to open the filing page with the row highlighted.
Income Statement
Source: Consolidated Statements of Operations [1] [2] [3] [4]. Click any linked figure to open the filing page with the row highlighted.
Columns marked E are consensus analyst estimates shown alongside reported results for direct comparison; they are not company guidance.
Estimate source: Yahoo Finance analyst consensus, as of 2026-07-20. Estimate figures link to the consensus source, not to filing pages.
Balance Sheet
Source: Consolidated Balance Sheets [7] [8] [9] [10]. Click any linked figure to open the filing page with the row highlighted.
Cash Flow
Source: Consolidated Statements of Cash Flows [11] [12] [13] [14]. Click any linked figure to open the filing page with the row highlighted.
Revenue by Geography
| Revenue by Geography | FY2022 | FY2023 | FY2024 | FY2025 | FY2026 |
|---|---|---|---|---|---|
| Americas | 17,983 | 21,250 | 23,289 | 25,143 | 27,193 |
| Europe | 6,016 | 7,163 | 8,128 | 8,891 | 10,017 |
| Asia Pacific | 2,493 | 2,939 | 3,440 | 3,861 | 4,315 |
| Total revenues | 26,492 | 31,352 | 34,857 | 37,895 | 41,525 |
Source: Note 2. Revenues — Total Revenue by Geographic Locations [5] [1] [15] [2]. Click any linked figure to open the filing page with the row highlighted.
Subscription Backlog Retention
| Subscription Backlog Retention | FY2022 | FY2023 | FY2024 | FY2025 | FY2026 |
|---|---|---|---|---|---|
| Total remaining performance obligation (RPO) | 43,700 | 48,600 | 56,900 | 63,400 | 72,400 |
| Current remaining performance obligation (cRPO) | — | 24,600 | 27,600 | 30,200 | 35,100 |
| Unearned revenue (deferred revenue) | 15,628 | 17,376 | 19,003 | 20,743 | 24,317 |
| Attrition rate | — | 7.5% | 8.0% | 8.0% | 8.0% |
Source: company filings [16] [17] [18] [19]. Click any linked figure to open the filing page with the row highlighted.
Workforce Non-Cash Costs
| Workforce Non-Cash Costs | FY2022 | FY2023 | FY2024 | FY2025 | FY2026 |
|---|---|---|---|---|---|
| Employees (period end) | — | 79,390 | 72,682 | 76,453 | 83,334 |
| Stock-based compensation expense | 2,779 | 3,279 | 2,787 | 3,183 | 3,509 |
| Amortization of deferred commissions (contract costs) | 1,348 | 1,668 | 1,925 | 2,095 | 2,197 |
Source: company filings [11] [20] [12] [21]. Click any linked figure to open the filing page with the row highlighted.
Capital Return Debt
| Capital Return Debt | FY2022 | FY2023 | FY2024 | FY2025 | FY2026 |
|---|---|---|---|---|---|
| Dividend per share (quarterly rate declared) | — | — | — | 0.40 | 0.42 |
| Treasury stock, at cost (cumulative repurchases) | — | 4,000 | 11,692 | 19,507 | 32,228 |
| Principal due on outstanding debt | 10,686 | 10,682 | 9,500 | 8,500 | 14,500 |
Source: company filings [7] [17] [22] [8]. Click any linked figure to open the filing page with the row highlighted.
Long-Term Record
| Fiscal year | Total revenue | Income from operations | Net income | Diluted net income per share | Net cash provided by operating activities | Capital expenditures | Total stockholders' equity |
|---|---|---|---|---|---|---|---|
| FY2017 | 8,437 | 218 | 323 | — | 2,162 | (464) | 8,230 |
| FY2018 | 10,540 | 454 | 360 | — | 2,738 | (534) | 10,376 |
| FY2019 | 13,282 | 535 | 1,110 | — | 3,398 | (595) | 15,605 |
| FY2020 | 17,098 | 297 | 126 | — | 4,331 | (643) | 33,885 |
| FY2021 | 21,252 | 455 | 4,072 | 4.38 | 4,801 | (710) | 41,493 |
| FY2022 | 26,492 | 548 | 1,444 | 1.48 | 6,000 | (717) | 58,131 |
| FY2023 | 31,352 | 1,030 | 208 | 0.21 | 7,111 | (798) | 58,359 |
| FY2024 | 34,857 | 5,011 | 4,136 | 4.20 | 10,234 | (736) | 59,646 |
| FY2025 | 37,895 | 7,205 | 6,197 | 6.36 | 13,092 | (658) | 61,173 |
| FY2026 | 41,525 | 8,331 | 7,457 | 7.80 | 14,996 | (594) | 59,142 |
Source: consolidated statements across filings; older years from the standardized feed [11] [1] [7] [12]. Click any linked figure to open the filing page with the row highlighted.
Operating KPIs
| KPI | FY2022 | FY2023 | FY2024 | FY2025 | FY2026 |
|---|---|---|---|---|---|
| Remaining performance obligation (RPO) | — | — | 56,900 | 63,400 | 72,400 |
Source: company-reported operating metrics [16] [19]. Click any linked figure to open the filing page with the row highlighted.
Analyst Consensus
Current price
Mean target
Median target
High target
Low target
Estimate source: Yahoo Finance analyst consensus, as of 2026-07-20. Estimate figures link to the consensus source, not to filing pages.
Traceability
346 of 401 figures on this page (86%) link to the filing page where they are printed — click a linked figure to open the source PDF at that page with the row highlighted. Unlinked figures come from standardized data feeds or pre-filing years.
Fiscal year ends January 31; e.g. FY2026 covers the year ended January 31, 2026.
Filename vs. filing offset: the corpus PDF annual_reports/CRM_annual_report_FY2022 is in fact Salesforce's FY2023 Form 10-K (latest income column is fiscal 2023), and annual_reports/CRM_annual_report_FY2024 is the FY2024 10-K (a duplicate is stored as CRM_annual_report_FY2023). Fiscal years were mapped by each filing's own latest reported column, not by the filename. There is no standalone FY2022 10-K in the corpus, so FY2022 figures are cited to the FY2023 10-K, where they appear as the comparative column.
FY2022 income statement and cash flow are cited to the FY2023 Form 10-K comparative columns; FY2022 balance sheet is the January 31, 2022 comparative column of that same filing.
Revenue by service offering: the company renamed 'Data' to 'Integration and Analytics' in Q4 FY2024, and in the FY2026 10-K prefixed each offering with 'Agentforce' (e.g. 'Agentforce Sales'); the underlying values are continuous across the renamings, so each row uses a stable label while the verbatim quotes preserve the printed names.
Sales-and-marketing operating expense line is printed as 'Marketing and sales' in the FY2023 and FY2024 Form 10-Ks and 'Sales and marketing' in the FY2025 and FY2026 Form 10-Ks; the row uses the current label and each quote is verbatim to its filing.
Remaining performance obligation (RPO) is disclosed by Salesforce in billions; it is shown here in the tab's millions unit (e.g. $72,400M = $72.4B) and the citation highlight lands on the printed billions figure. FY2022 and FY2023 RPO are not shown (not disclosed in the annual-report revenue notes available in the corpus).
Quarterly cash-flow single quarters use the three-month columns printed in each 10-Q; Q4 FY26 (all statements) is derived from the FY2026 Form 10-K less the Q3 FY26 nine-month year-to-date figures and is marked accordingly.
All feed-vs-filing spot checks (total revenue, net income, operating cash flow, capital expenditures across FY2022–FY2026) reconciled to the filings within rounding; no material discrepancies were found.
FY2017–FY2021 long-term figures are from the standardized SEC XBRL data feed and are shown without page links; diluted EPS before FY2021 is not shown.
Salesforce, Inc.'s management answers for the business every quarter. These are the exchanges that explain it best — verbatim, from the call transcripts preserved in Sources. Each link opens the full transcript at that page in a new tab.
Q4 & Full Year FY2026 Earnings Call — Q4 FY2026
The most recent call: a new short-format quarter where capital allocation (a $50B buyback), Agentforce's scale, and AI's margin math get pressed. · Open the full transcript →
The hard question: can Agentforce grow while CRPO — the forward-revenue signal — decelerates to 9%.
Keith Weiss (Morgan Stanley); Robin Washington (CFO): Congratulations on a solid end to FY '26, especially with the numbers associated with Agentforce. However, CRPO growth was somewhat disappointing, growing at 9%. Can you talk about the ability of Salesforce to grow the Agentforce business while also bringing along the entire portfolio of products? […] We're monetizing AI in multiple ways and are seeing great growth in our premium SKUs. Our seats are continuing to grow. We're excited about the incremental value that Agentforce brings, which was illuminated through our customer successes shared today.
p. 3 · Read in context →
Unit economics of AI: whether consumption (AWUs) dilutes gross margin — management says neutral near-term.
Gabriela Borges (Goldman Sachs); Robin Washington (CFO): Can you explain the $2.4 billion in AWUs? How do you monetize this, and what impact does i have on gross margin? […] In the short run, we anticipate being neutral on gross margins. We’re building efficiencies into our product development to control costs and drive margins higher over time.
p. 4 · Read in context →
Q3 FY2026 Earnings Call — Q3 FY2026
The clearest recent read on how the AI business actually works: the consumption flywheel, the DIY-versus-buy debate, and why margins are protected. · Open the full transcript →
The consumption flywheel quantified: Agentforce ARR +330%, over half of bookings from customers "refilling the tank."
Robin Washington (Chief Operating and Finance Officer): Our consumption flywheel is spinning. Agent force accounts and production increased 70%. Quarter over quarter. And more than 50% of agent force bookings came from customers refilling the tanks. Agent force and data 360 ARR was up 100% year over year. This is inclusive of agent force ARR, which is up 330% year over year. […] And I'm pleased to share that for the first time since fiscal year 2022, net new AOV growth outpaced AOV growth.
p. 7 · Read in context →
Capital-allocation stance on AI infrastructure: rent data centers, don't build them, to protect gross margin.
Brad Zelnick (Deutsche Bank); Marc Benioff (Chair and CEO): I think number one, wanna make sure everybody realizes we're not building data centers at Salesforce. We're preserving our gross margins. And our cash flow. But we will use the data centers that are being built and, we will take advantage of the lower costs that we're seeing in the market from the incredible build out of data centers. […] I think it will do about $10 billion next year in business. So this is a very significant software business.
p. 10 · Read in context →
Q4 & Full Year FY2025 Earnings Call — Q4 FY2025
The annual wrap and leadership handoff where the market first pressed on whether Agentforce is real revenue and whether SaaS survives the agentic era. · Open the full transcript →
Guidance discipline: despite the hype, management models Agentforce as only a modest FY26 revenue contributor.
Amy Weaver (President and Chief Financial Officer): Finally, on Agentforce, we are incredibly excited about the customer momentum we are seeing. However, the adoption cycle is still early as we focus on deployment with our customers. As a result, we are assuming a modest contribution to revenue in fiscal '26. We expect the momentum to build throughout the year, driving a more meaningful contribution in fiscal '27.
p. 7 · Read in context →
The existential bear case — does AI reduce SaaS to a database? — met with the apps-data-agents "holy trinity."
Kash Rangan (Goldman Sachs); Marc Benioff (Chair and CEO): there's been a lot of debate about the SaaS technology in the business model. Can the SaaS tech stack that you built and pioneered, how does that fit into the agentic world? Is there a risk that SaaS just becomes a project database? […] I believe there is kind of a holy trinity here of AI CRM, which is the apps, the data and the agents. And these three things have to kind of work together. […] the agentic layer is very important, but it doesn't operate by itself. It operates with data, with a Data Cloud that has to be federated through your company to all your data sources and humans, we're still here.
p. 13 · Read in context →
Q3 FY2025 Earnings Call — Q3 FY2025
The Agentforce launch call — where the new consumption pricing model ($2 a conversation) and the digital-labor pitch were first laid out. · Open the full transcript →
A margin-history milestone paired with candor: Agentforce closed 200 deals in a week but isn't yet moving cRPO.
Amy Weaver (President and Chief Financial Officer): And I am very pleased to share that this quarter, our GAAP operating margin hit 20% for the first time in company history. […] As you heard from Marc, Agentforce's momentum in Q3 was incredible with over 200 deals closed in only one week. However, given we are early in our adoption cycle, it is not yet a material contributor to cRPO.
p. 4 · Read in context →
What the first 200 Agentforce deals actually are — Service Cloud add-ons, and "tip of the iceberg."
Keith Weiss (Morgan Stanley); Brian Millham (President and Chief Operating Officer): When it comes to those 200 deals that you've already signed for Agentforce, maybe you could give us some color on what those deals look like? Do they tend to be upsells? What type of uplift do you see if you're upselling into customers? […] We are seeing incredible traction with our customers as add-ons to many of our Service Cloud offerings. Obviously, you know Service Cloud is our largest cloud and our initial Agentforce opportunity is with our Service Cloud customers right now […] those 200 deals, sort of, tip of the iceberg when we think about the opportunity that's ahead of us for Agentforce.
p. 7 · Read in context →
The original Agentforce pricing — $2 a conversation — and the $100-vs-$1.50 economics that justify it.
Raimo Lenschow (Barclays); Brian Millham (COO); Marc Benioff (Chair and CEO): how is the discussion about how you kind of participate or work with the clients about pricing for Agentforce going or like how should we think about it? […] it's a usage-based structure and at $2 a conversation, we feel like the value is very high for our customers given what they're spending today in a lot of their conversations […] An agent could have handled that call, which likely cost the hospital around $100, while we could have done it for about $1.50. This highlights the message for our clients about relieving some of their staff to focus on strategic priorities, rather than on administrative tasks that higher levels could efficiently delegate elsewhere.
p. 7 · Read in context →
Q1 FY2024 Earnings Call — Q1 FY2024
The profitability-transformation landmark after the 2023 activist campaign — a 1,000 bps margin jump — and the earliest framing of how Salesforce would charge for AI. · Open the full transcript →
Is the margin gain just timing? — management separates durable restructuring from a still-to-come second phase.
Raimo Lenschow (Barclays); Amy Weaver (President and Chief Finance Officer): The improvement in profitability or the raised guidance for profitability and cash, is that all timing? Can you talk a little bit about that? Is it just timing or are there other factors we should consider in here? […] What really drove the 27.6 was two things: the actions we took announced in January with the restructuring and executing on that, as well as having a very disciplined reinvestment strategy […] I would divide overall transformation into two stages: benefits we're getting from that initial transformation—again, that's what you’re seeing in Q1 and this year—and then the second stage, which is as we've been going through this comprehensive operating and go-to-market review, that review is going to enable the second phase of our transformation that’s going to be ongoing and long-term over the next few years.
p. 11 · Read in context →
More calls
Q2 FY2026 Earnings Call — Q2 FY2026 · 16 pages · The Agentforce ramp between launch and scale — management reallocating resources toward data and AI, with the Informatica deal pending integration. · Open →
Q1 FY2026 Earnings Call — Q1 FY2026 · 4 pages · Where Benioff lays out the $8 billion Informatica acquisition and its rationale as the data layer under Salesforce's AI. · Open →
Q4 & Full Year FY2024 Earnings Call — Q4 FY2024 · 11 pages · The FY2024 wrap that completed the profitability turnaround and announced the first-ever dividend and the 30%-margin milestone. · Open →
Q3 FY2024 Earnings Call — Q3 FY2024 · 11 pages · The mid-transformation quarter where the Einstein 1 Platform and Data Cloud were positioned as the AI on-ramp, a year before Agentforce. · Open →
Q2 FY2025 Earnings Call — Q2 FY2025 · 4 pages · The steadier quarter after the Q1 growth scare, setting up the Agentforce reveal at Dreamforce. · Open →
Q2 FY2024 Earnings Call — Q2 FY2024 · 5 pages · Early in the turnaround, with the non-GAAP operating margin ramping toward the 30% target. · Open →
Salesforce, Inc.'s annual reports contain management's most considered account of the business. These are the sections, passages and visual pages worth opening in the originals preserved in Sources.
Salesforce, Inc. — FY2026 Annual Report (Form 10-K, fiscal year ended January 31, 2026) — FY2026
Latest 10-K: reframes Salesforce as an AI 'agentic enterprise' platform and renames the entire revenue taxonomy around Agentforce. · Open the full document →
Item 1. Business — Overview and Service Offerings — p. 6 · Read the full section →
Management's own description of what the company is and the AI-agent products it sells.
Overview: from 'CRM leader' to the platform helping organizations become 'agentic enterprises.'
Salesforce, Inc. (“Salesforce,” the “Company,” “we” or “our”) is a global leader in customer relationship management (“CRM”) technology, helping organizations of any size become agentic enterprises. Founded in 1999, we bring humans, agents, applications, and data together on a trusted, unified platform to unlock growth and innovation.
p. 6 · Read in context →
The core offerings — Agentforce Sales, Service, and the 360 Platform — all built around AI agents.
Agentforce Sales. Our Agentforce Sales offering is an integrated platform that brings together the power of humans with AI agents to help sales teams sell faster and smarter, and to efficiently manage and automate entire sales processes. […] Agentforce Service. Our Agentforce Service offering enables companies in every industry to bring all of their customer, employee, IT and field service needs onto one integrated, AI-powered platform to deliver trusted, highly personalized customer support at scale. […] Agentforce 360 Platform, Slack and Other. The Agentforce 360 Platform enables companies of all industries, sizes, and locations to build business workflows, applications and AI agents on a single, comprehensive platform to help automate processes, boost efficiency, increase productivity and reduce information technology costs.
p. 8 · Read in context →
Our Business and Growth Strategy — p. 12 · Read the full section →
The levers management is pulling for growth, in its own words.
Growth strategy: cross-sell/upsell into the installed base, then extend go-to-market globally.
Expand relationships with existing customers. We see significant opportunities to deepen existing customer relationships through cross-selling and upselling our service offerings. […] Increase geographic reach. By extending our go-to-market capabilities globally, we aim to grow our business by selling to new customers in new regions.
p. 12 · Read in context →
Mergers and Acquisitions and Strategic Investments — p. 14 · Read the full section →
The stated M&A test behind a deal-heavy history, including the November 2025 Informatica acquisition.
Acquisitions must accelerate strategy, monetize quickly, and show a clear timeline to value accretion.
We evaluate opportunities to acquire or invest in complementary businesses, services, technologies and intellectual property to complement our organic innovation and advance the development of our Agentforce 360 Platform. Our evaluation seeks to confirm that any potential acquisition accelerates our strategy, represents an attractive customer opportunity, provides a pathway to effectively monetize the acquired products and drive significant operational efficiencies and presents a clear timeline for value accretion.
p. 14 · Read in context →
Item 1A. Risk Factors — p. 20 · Read the full section →
Two company-specific risks that could bite: intense, now AI-driven competition, and Salesforce's recurring sales reorganizations.
Competition: low barriers to entry, and AI is raising the intensity inside Salesforce's own markets.
The market for enterprise applications and platform services is highly competitive, rapidly evolving, fragmented and subject to changing technology, low barriers to entry, shifting customer needs and frequent introductions of new products and services. […] Additionally, as we continue to increasingly build AI into many of our offerings, we face more competition as AI technologies are increasingly integrated into the markets in which we compete.
p. 29 · Read in context →
Sales reorganizations — a recurring Salesforce event — can cut productivity and slow the growth rate.
We periodically change and make adjustments to our sales organization in response to market opportunities, competitive threats, management changes, product introductions or enhancements, acquisitions, sales performance, increases in sales headcount, cost levels and other internal and external considerations. Such changes have in some periods resulted in, and may in the future result in, a reduction of productivity, which could negatively impact our operating results.
p. 26 · Read in context →
Item 7. MD&A — Sources of Revenues — p. 54 · Read the full section →
How the money is actually made: one operating segment, subscription-dominated, recognized ratably.
One reporting segment; two revenue sources, with subscription and support ~95% of total revenue.
We operate as one segment. […] We derive our revenues from two sources: (1) subscription and support revenues and (2) professional services and other revenues. Subscription and support revenues accounted for approximately 95 percent of our total revenues for fiscal 2026.
p. 54 · Read in context →
Item 7. MD&A — Results of Operations — p. 61 · Read the full section →
Where management explains what drove results — margins, opex, and the newly Agentforce-branded revenue mix.
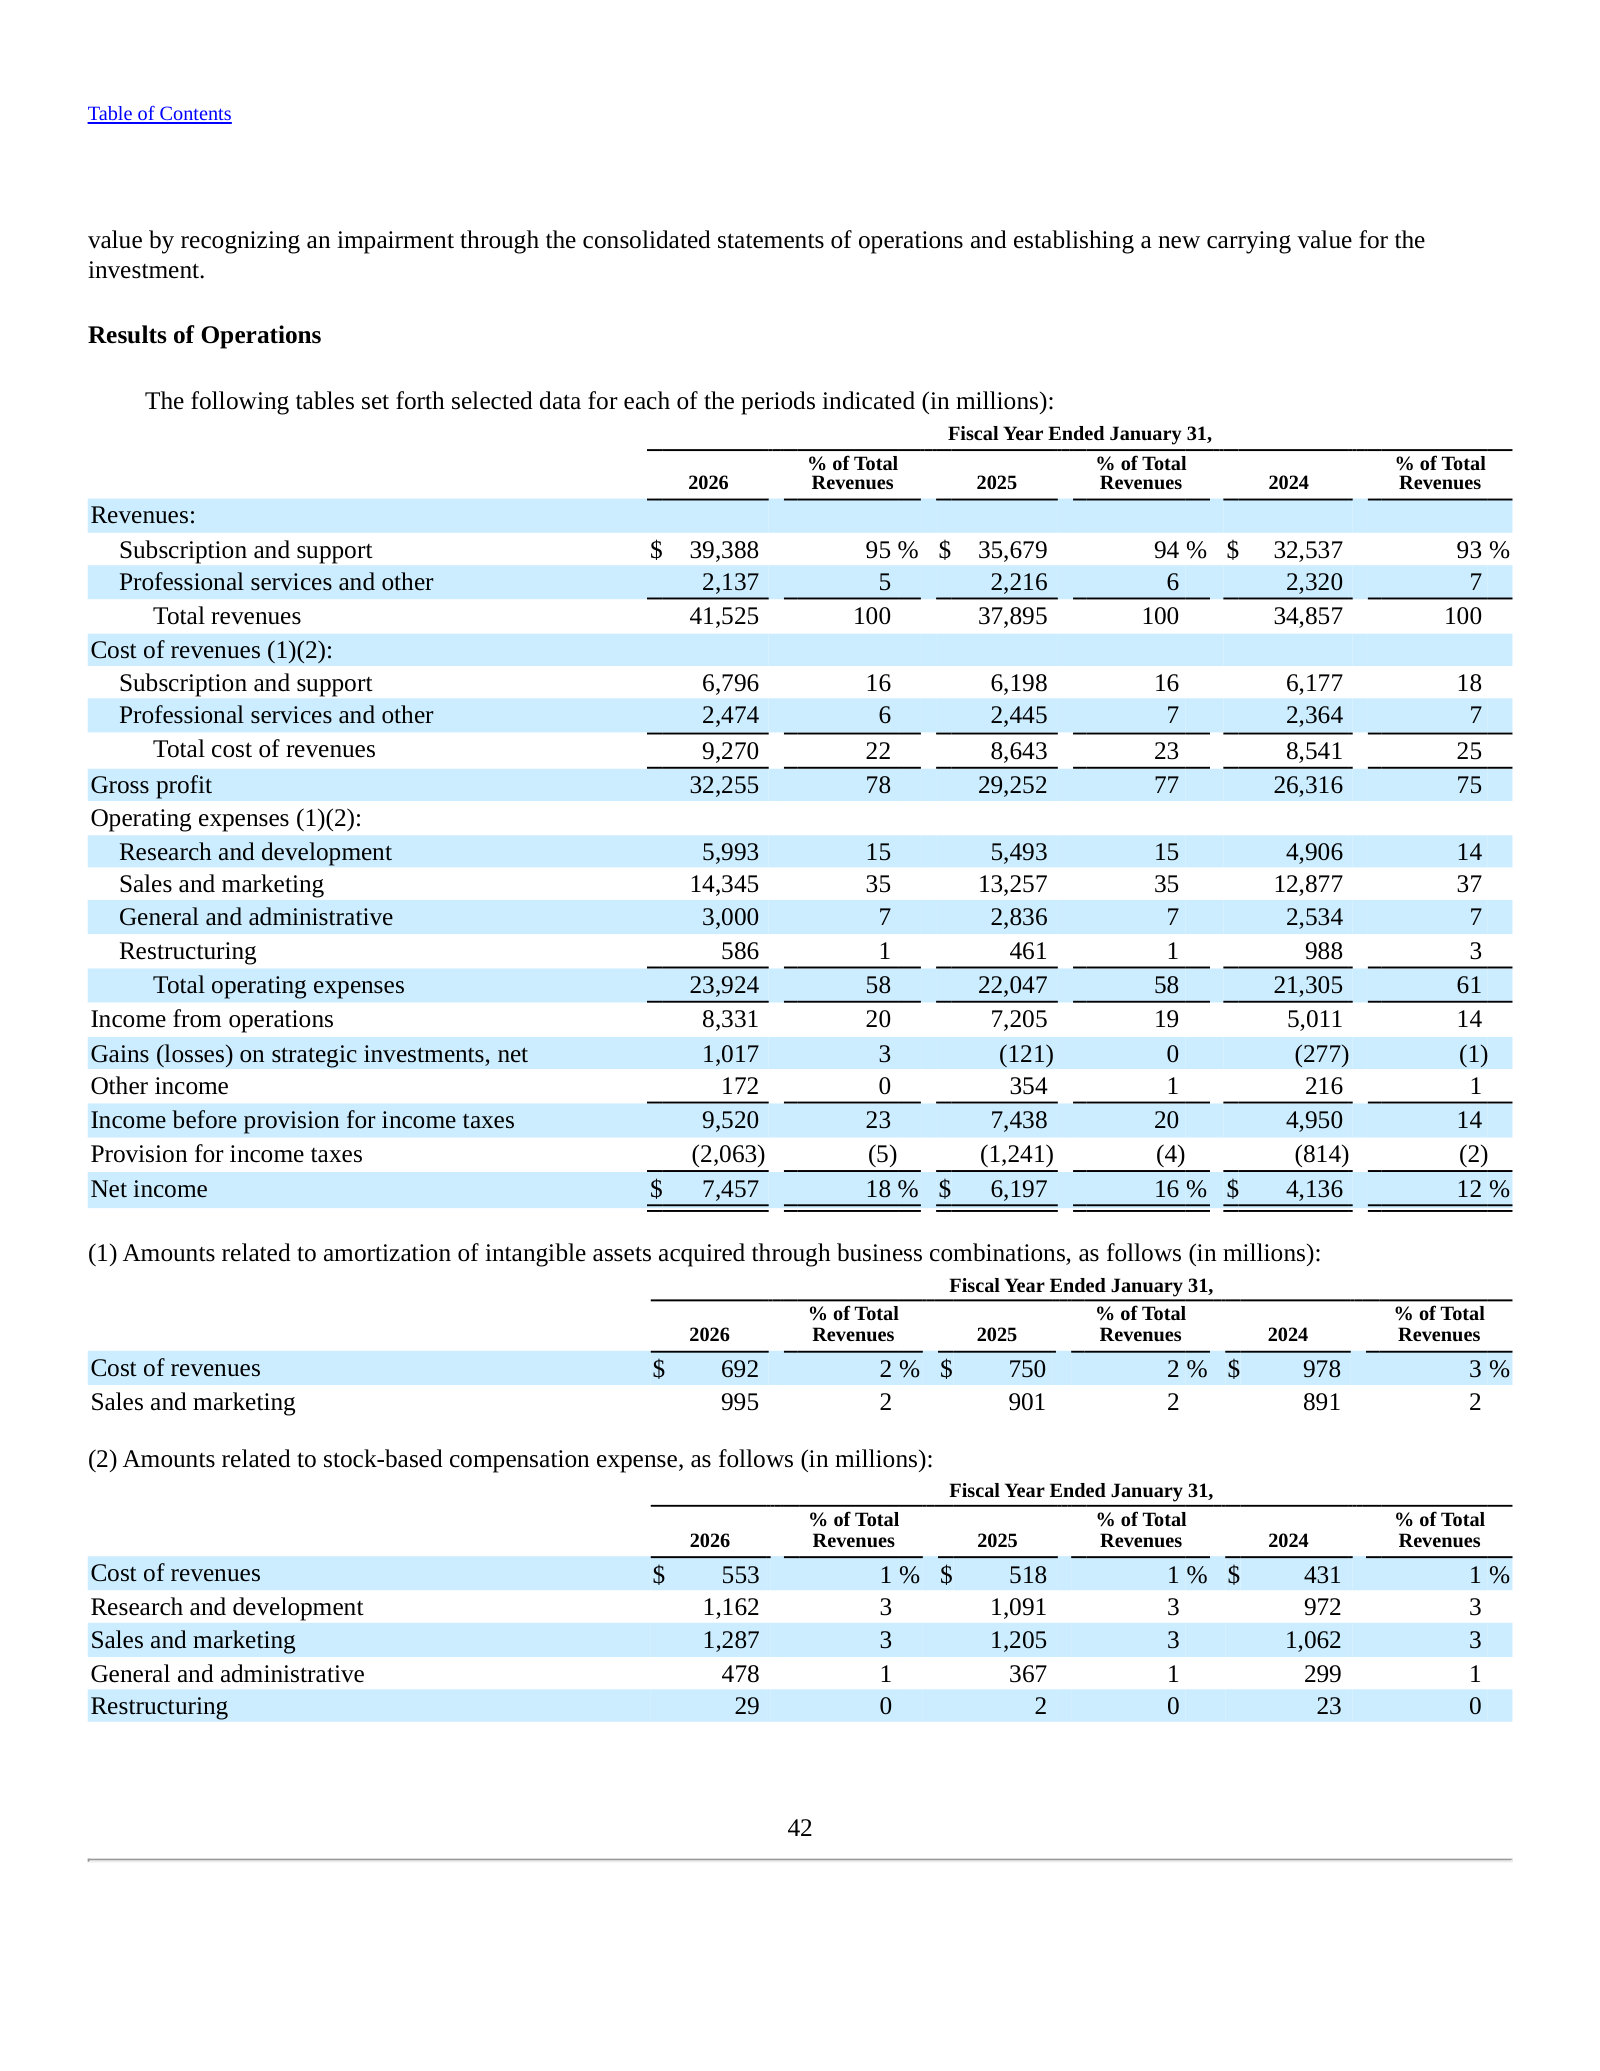
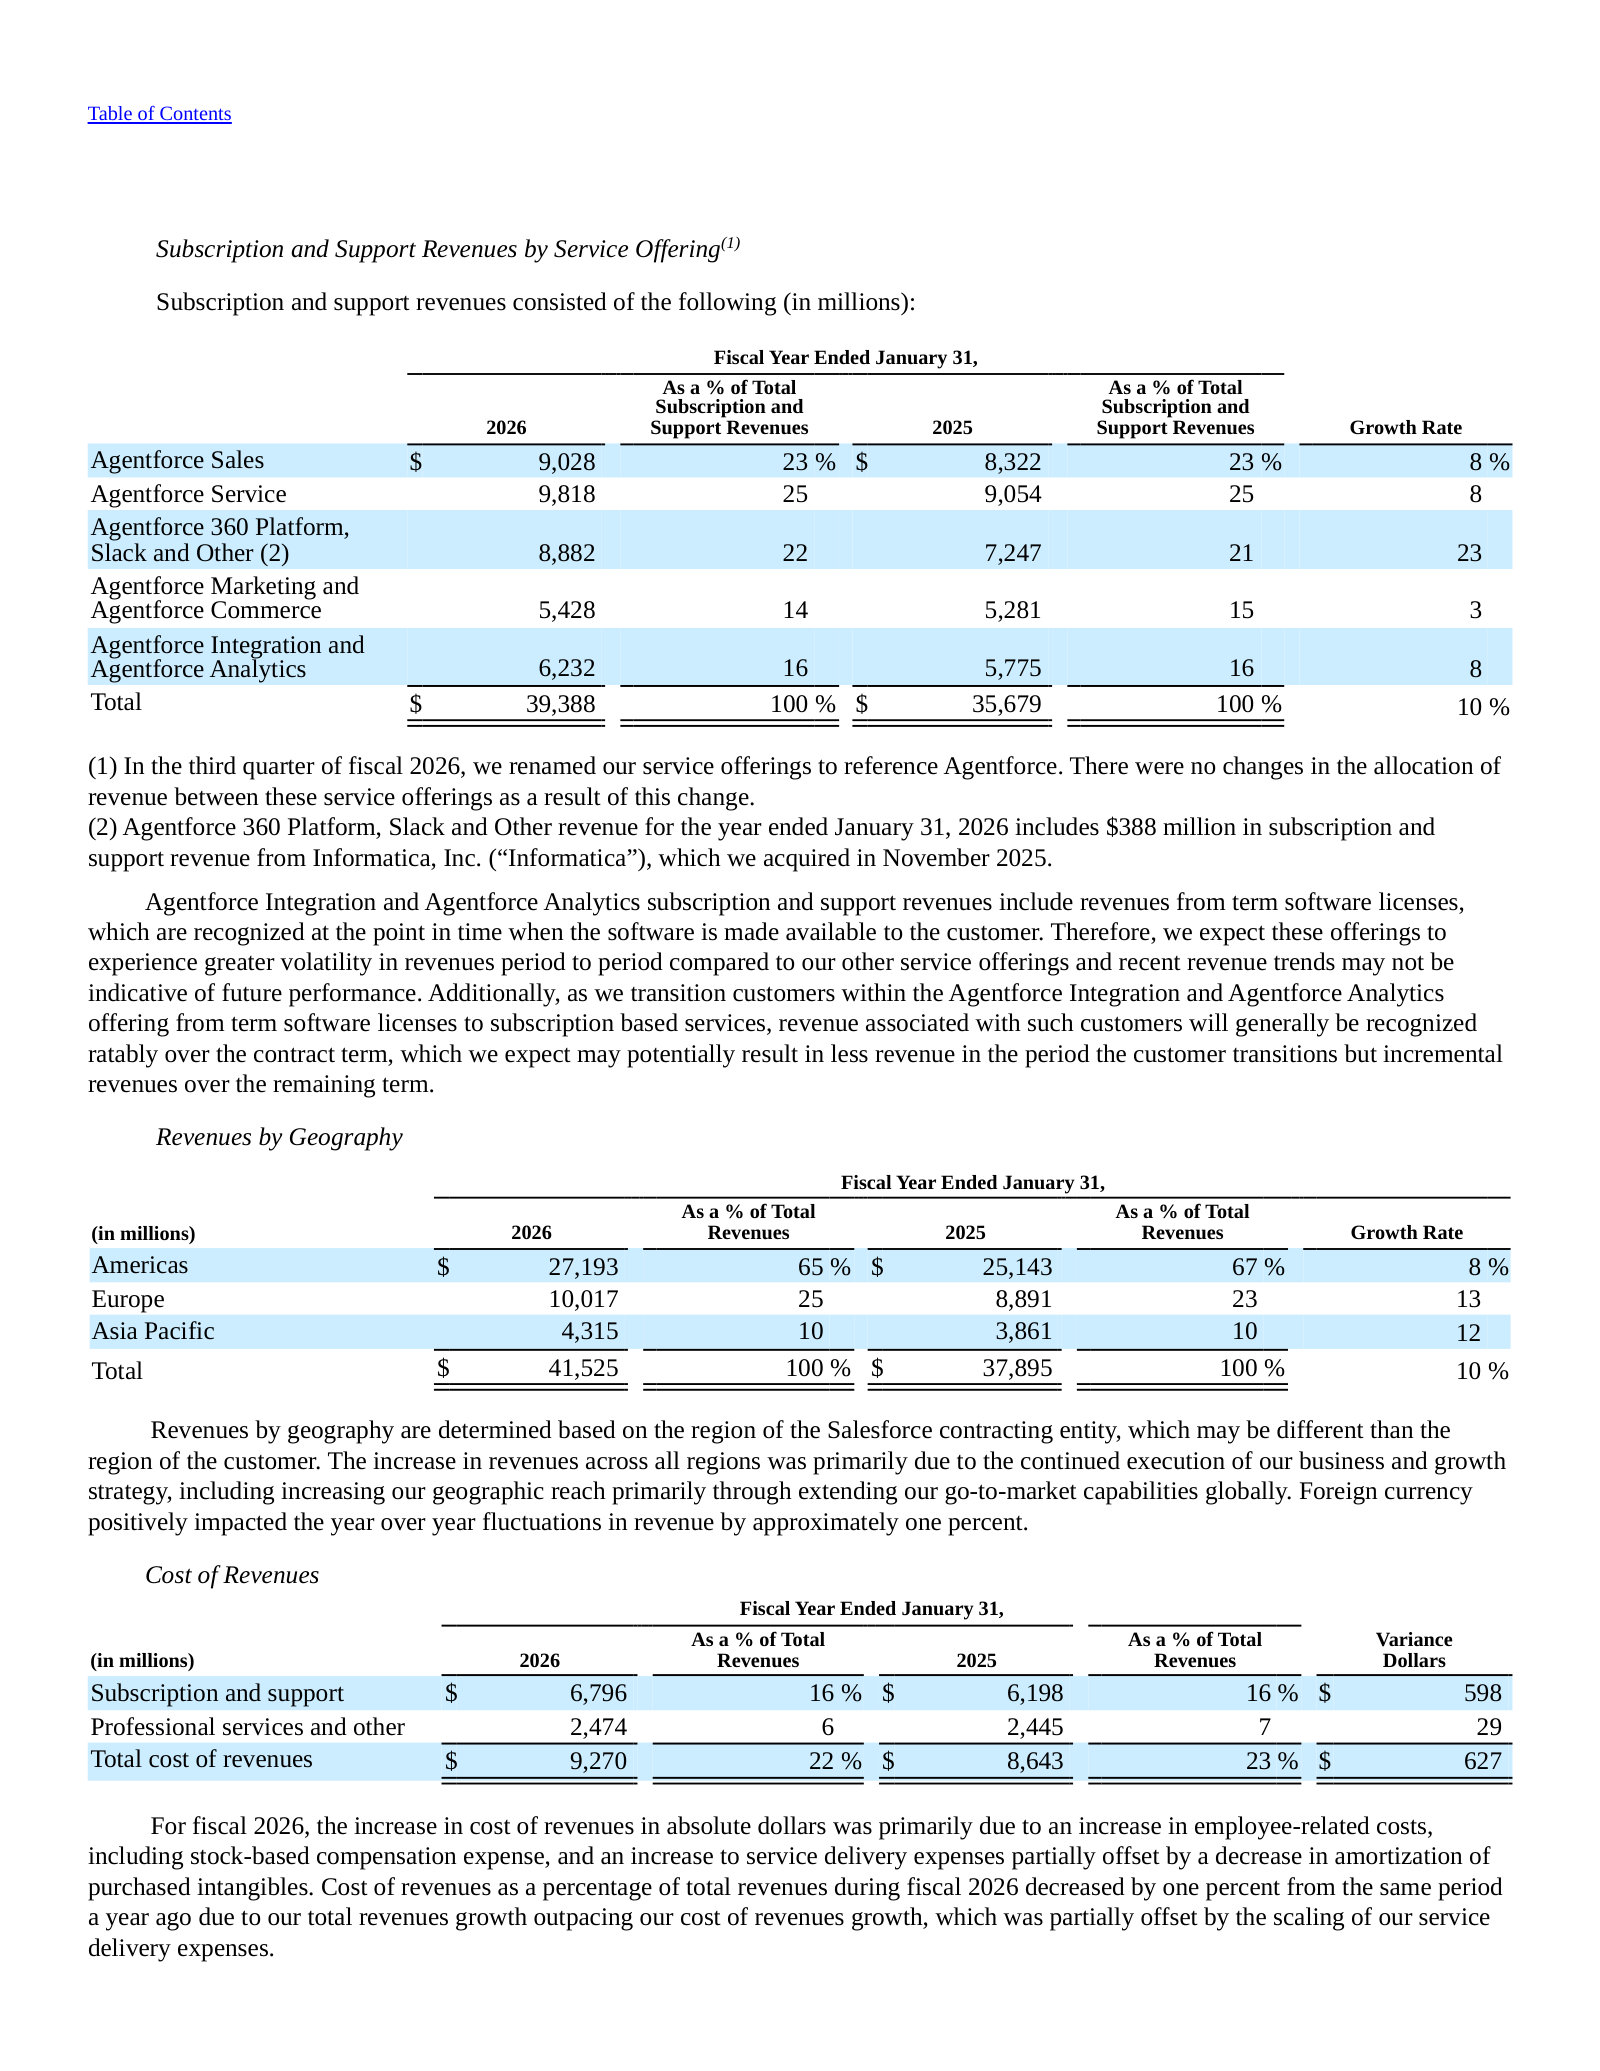
Item 7. MD&A — Cash Flows — p. 68 · Read the full section →
The cash engine behind the P&L: operating cash flow and what it converts from.
Operating cash flow of ~$15.0B: $7.5B net income plus D&A and stock-based compensation.
The net cash provided by operating activities during fiscal 2026 was primarily comprised of net income of $7.5 billion, adjusted for non-cash items, including $3.6 billion of depreciation and amortization and $3.5 billion of stock-based compensation expense.
p. 68 · Read in context →
Salesforce, Inc. — FY2023 Annual Report (Form 10-K, fiscal year ended January 31, 2023) — FY2023
Included to show the pre-Agentforce identity: 'Customer 360' and Slack as 'digital headquarters,' with revenue named by function, not AI agent. · Open the full document →
Item 1. Business — Overview — p. 6 · Read the full section →
Two years before the rebrand, the self-description centered on 'Customer 360' and Slack — with no AI-agent framing.
FY2023 identity: 'Customer 360' unifying teams and Slack as a 'digital headquarters.'
Our Customer 360 platform unites sales, service, marketing, commerce and IT teams by connecting customer data across systems, apps and devices to create a complete view of customers. […] With Slack, we provide a digital headquarters where companies, employees, governments and stakeholders can collaborate to create success from anywhere.
p. 6 · Read in context →
Item 7. MD&A — Subscription Revenues by Service Offering — p. 47 · Read the full section →
The revenue taxonomy before FY2026: clouds named by function (Sales, Service, Platform, Marketing & Commerce, Data).
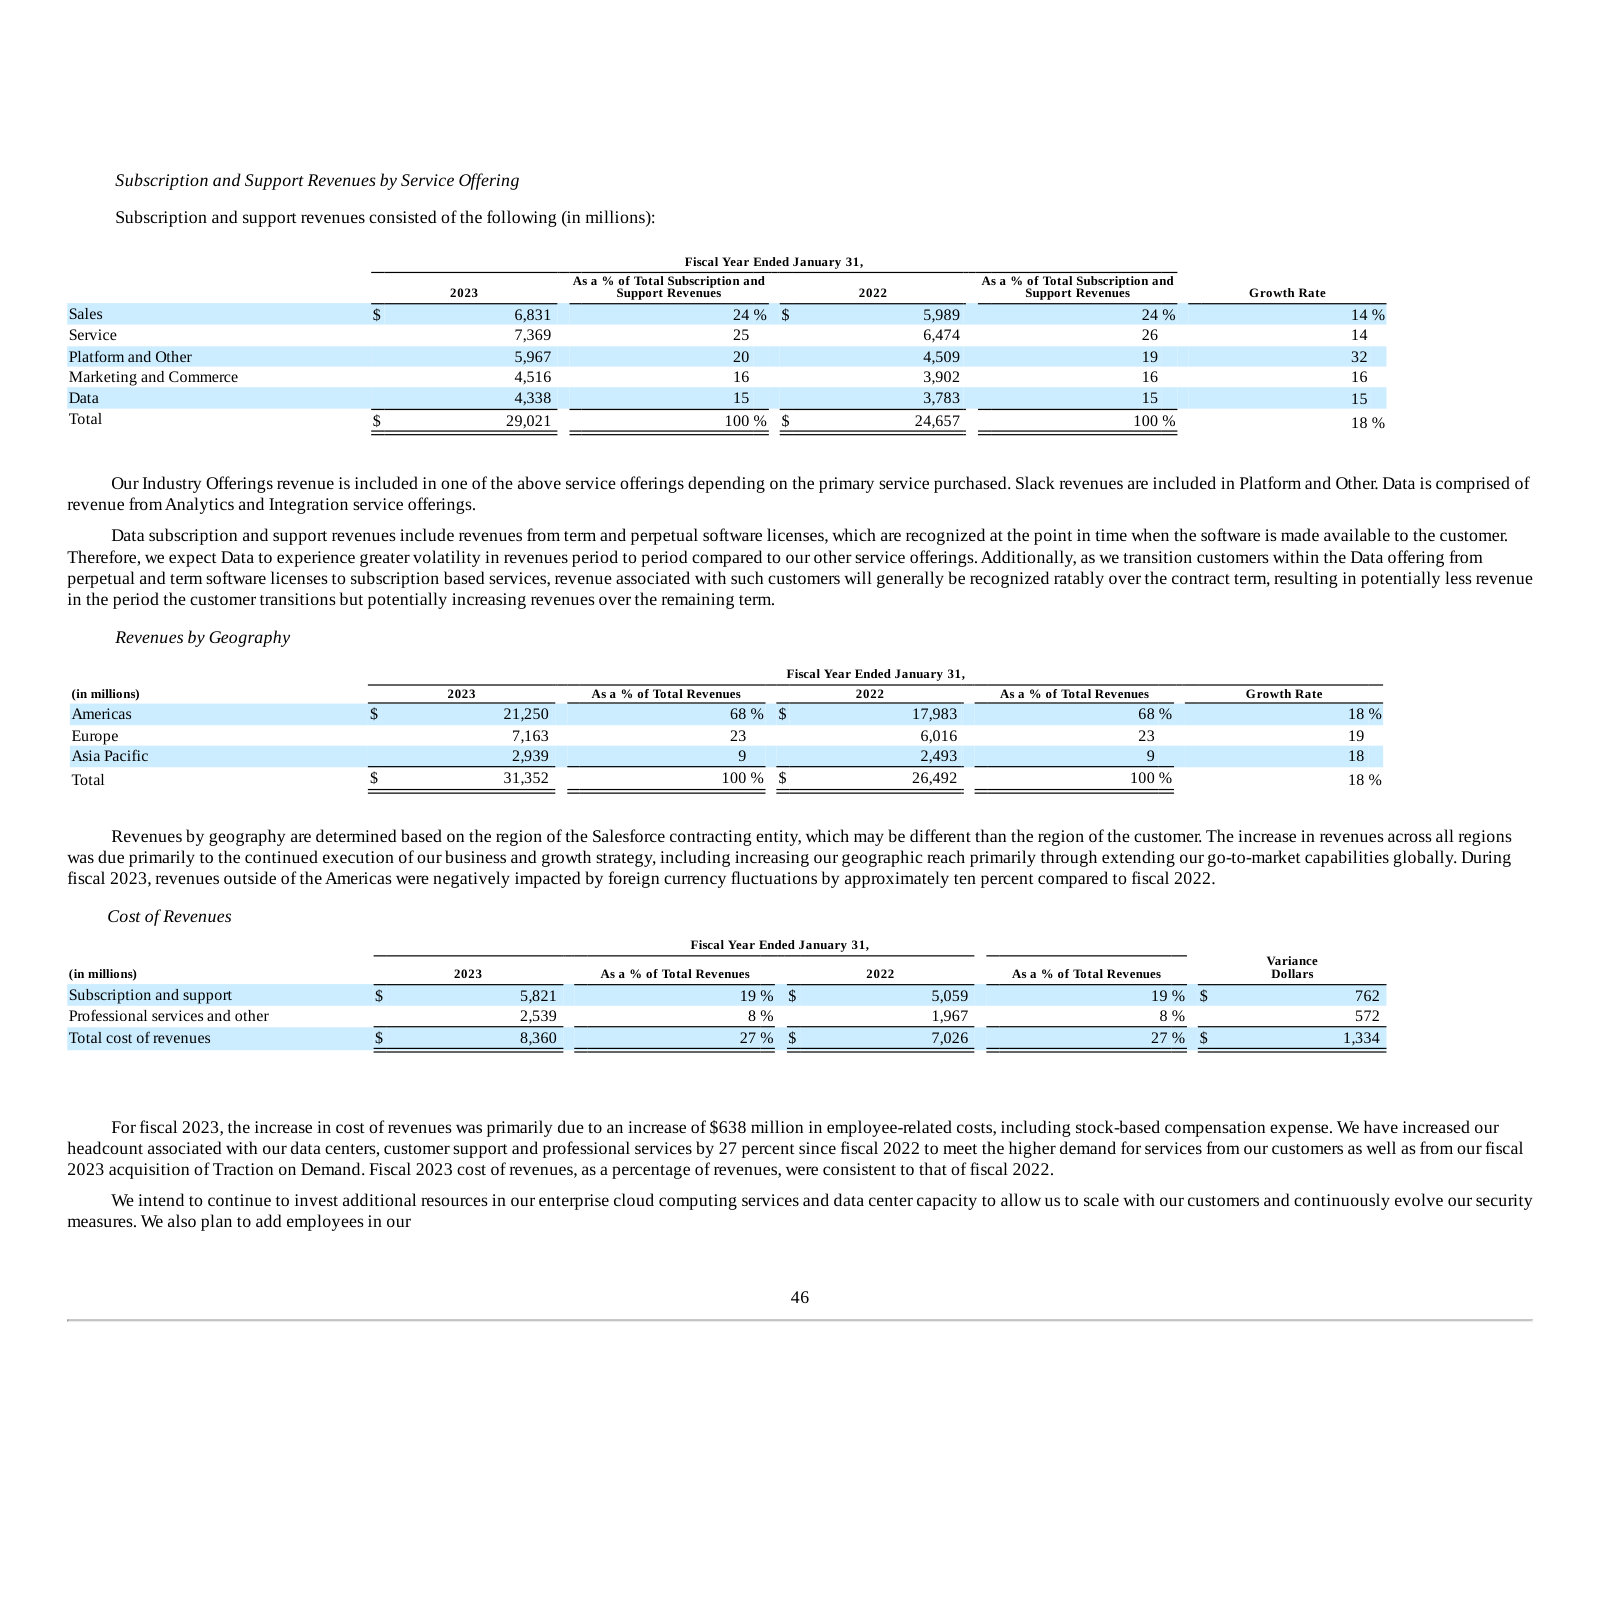
More annual reports
Salesforce, Inc. — FY2025 Annual Report (Form 10-K, fiscal year ended January 31, 2025) — FY2025 · 138 pages · The Einstein 1 / Data Cloud year immediately before the Agentforce rebrand; useful for tracing the AI pivot. · Open →
Salesforce, Inc. — FY2024 Annual Report (Form 10-K, fiscal year ended January 31, 2024) — FY2024 · 142 pages · The margin-inflection and 'Restructuring' year, when Salesforce pivoted hard toward profitability. · Open →
Competitors describe Salesforce, Inc.'s market in their own filings and calls. These verified passages and visual pages show where their strategies meet, using source documents preserved in Sources.
ServiceNow, Inc. (NOW)
The most direct threat to Salesforce's core franchise: ServiceNow has formally added a "CRM and Industry" product line (customer service, field service, sales, order management, CPQ) and its management explicitly positions its AI platform as the modern replacement for "legacy CRM." Its Now Assist agents collide head-on with Salesforce's Agentforce, and it pitches itself as the cross-functional "platform of platforms" that consolidates point-solution SaaS suites.
ServiceNow CEO Bill McDermott, on the Q3 FY2025 call, frames prior CRM deployments as a "sprawling mess of instances and silos" and positions ServiceNow's AI platform — including a new AI-powered CPQ — as the tool that turns CRM into an "AI-first system of action." This is ServiceNow's stated case for reshaping the customer-experience market that Salesforce leads.
Enterprises invested a lot into legacy CRM deployments. For all that investment, they got a sprawling mess of instances and silos. They want a better way with AI. This applies to many legacy vendors, some more than others. Here's why ServiceNow is reshaping the customer experience market. Our AI experience turns CRM into an AI-first system of action that drives growth and customer loyalty. In sales, a new AI-powered CPQ solution accelerates quote generation, and this is going to free businesses to focus on relationships.
p. 1 · Read in context →
On the Q4 FY2025 call, ServiceNow sizes the agentic-AI opportunity (an IDC estimate of 2.2 billion AI agents by 2030) and states outright that it intends to win "in IT, HR, CRM, app development, and beyond" — naming CRM as one of the workflow categories it is contesting.
IDC estimates there will be 2.2 billion AI agents in the world by 2030. Millions of those will be built on the ServiceNow platform. Whatever isn't built on our platform will be governed and secured by our AI control tower. ServiceNow is a build-or-buy winner. We'll win with the builders because they want ServiceNow for our data fabric, our agents, governance, and security. We'll win for buyers because they want best-of-breed AI native workflows and agents to reinvent their status quo in IT, HR, CRM, app development, and beyond.
p. 2 · Read in context →
ServiceNow's FY2025 10-K now lists "Customer Relationship Management (CRM) and Industry" as one of its four core product areas — the audited, on-the-record statement that its products reach into customer service, field service, sales and order management, the heart of Salesforce's Sales and Service Cloud.
Our products are grouped into four areas: Technology, Customer Relationship Management ("CRM") and Industry, Core Business, and Creator and Other. […] Our CRM and Industry products help organizations integrate front-end customer service functions with operations, field service resources, sales processes and order management, and provide workflows tailored for specific industries.
p. 7 · Read in context →
Adobe Inc. (ADBE)
Adobe's Digital Experience business — Adobe Experience Platform, Real-Time CDP, Journey Optimizer and Marketo Engage — is the closest analog to Salesforce's Marketing Cloud and Data Cloud, competing for the same CMO and Chief Digital Officer budgets. Its AEP Agent Orchestrator and Brand Concierge push it into the same agentic-AI-for-marketing race as Salesforce's Agentforce.
On the Q1 FY2026 call, Adobe's Anil Chakravarthy claims category leadership in customer-experience management — "the leading customer data platform" serving 99 of the Fortune 100 — the same customer-data and marketing turf Salesforce contests with Data Cloud and Marketing Cloud.
Adobe pioneered the category of customer experience management. Enterprises around the world rely on our software to identify prospects, acquire new customers, engage and delight them with personalized experiences and grow customer lifetime value. We are the leading provider of content management systems for websites and mobile apps and the leading customer data platform that serves as the foundation in enterprises for digital customer engagement. We serve 99 of the Fortune 100 and are the digital platform of choice for Chief Marketing Officers and Chief Digital Officers for their ongoing campaigns and for major marketing moments like the Olympics
p. 4 · Read in context →
Adobe's stated view of a shift "from the SaaS model to the agentic software model," built around its AEP Agent Orchestrator — the strategic pivot that puts Adobe in the same agentic-marketing contest as Salesforce's Agentforce, while it also chooses to interoperate with Microsoft and ServiceNow orchestrators.
We see this as a massive transformation from the SaaS model to the agentic software model. And as you saw at Summit, we announced the AEP Agent Orchestrator. And our view is, we build agents where we have core domain knowledge and we can really democratize the use of our applications to a wide variety of marketing and customer experience practitioners. We also want to work with agent orchestrators from Microsoft, ServiceNow, other partners because we believe that enterprises will ultimately build their own agents and have multiple ways of using agents.
p. 12 · Read in context →
Adobe's FY2025 10-K describes its Experience Platform Agent Orchestrator — an agentic framework that plans multi-step actions and powers functional agents for "customer experience orchestration" on top of its customer-data platform, mapping directly onto Salesforce's Agentforce-plus-Data-Cloud architecture.
Adobe Experience Platform Agent Orchestrator is the technology underpinning Adobe's agentic framework, powering the ability to understand context, retrieve precise information, plan multi-step actions, drive intelligent automation, refine responses, and automate key workflows. Agent Orchestrator is designed to leverage rich data, content, and knowledge from Adobe Experience Platform to power functional agents for customer experience orchestration that accelerate tasks, make decisions, and act as a talent multiplier for customers focused on driving business growth through personalization at scale.
p. 16 · Read in context →
Snowflake Inc. (SNOW)
Snowflake's AI Data Cloud competes with Salesforce's Data Cloud (and Tableau) to be the single governed store of enterprise data that AI agents run on. The relationship is coopetition — Snowflake has zero-copy data-sharing agreements with Salesforce — but its Cortex and Snowflake Intelligence agents increasingly reach into the same customer-data and agentic workloads Salesforce is chasing.
Snowflake management names Salesforce directly, describing zero-copy data-sharing agreements with it (and with ServiceNow, SAP and Workday) while positioning Snowflake as the "single pane of glass" data layer at the center of its customers' data — the coopetition that underlies Salesforce's own Data Cloud strategy.
We see these as a win-win. We have these agreements with ServiceNow, Salesforce, SAP with the recent partnership, as well as Workday. These products continue to drive our broader mission to be at the center of all of the data needs that our customers have, and they just make the process of data collaboration between the SaaS vendors and Snowflake Inc. much easier. And we are very happy with these agreements. What this means is that Snowflake Inc. will continue to be the place for our customers to get that single pane of glass view on everything that matters to them.
p. 7 · Read in context →
Snowflake's FY2026 10-K scale markers for the AI-data market it contests: 13,328 total customers, 790 of the Forbes Global 2000, and a 125% net revenue retention rate — reference points against Salesforce's Data Cloud and analytics footprint.
As of January 31, 2026, we had 13,328 total customers, increasing from 10,996 customers as of January 31, 2025. As of January 31, 2026, our customers included 790 of the Forbes Global 2000, based on the 2025 Forbes Global 2000 list, and those customers contributed approximately 43% of our revenue for the fiscal year ended January 31, 2026. […] our net revenue retention rate, which was 125% as of January 31, 2026.
p. 7 · Read in context →
Snowflake's CEO describes building "a little bit of a customer 360" — all of a customer's information in a single chatbot — on Snowflake data, an agentic use case that echoes the unified-customer-view idea at the center of Salesforce's Customer 360 positioning.
they're creating a little bit of a customer 360. All of the information that is relevant to a customer, available in a single chatbot. And I use this kind of functionality very frequently. Where if I'm going to have a meeting with a customer, I want to know everything about them that we know.
p. 12 · Read in context →
Shopify Inc. (SHOP)
Shopify's commerce platform competes with Salesforce's Commerce Cloud, and its move upmarket into enterprise and B2B commerce takes it onto Salesforce's traditional large-brand turf. Its agentic-commerce stack (Catalog, Universal Cart, Checkout Kit) and the industry protocol it co-founded put it at the center of AI-driven shopping — a market Salesforce is also targeting.
On the Q1 FY2026 call, Shopify names Salesforce as one of the large platforms joining its Universal Commerce Protocol (UCP) council for agentic commerce — Shopify's framing of who is aligning around the standard it co-developed, with Salesforce among them.
We are now seeing the biggest and most innovative companies across essentially the entire industry coming together around UCP to help push agentic commerce forward. And last month, Amazon, Meta, Microsoft, Salesforce and Stripe all joined the council, committing their expertise in Internet-scale transaction processing to build one universal protocol for commerce.
p. 2 · Read in context →
Shopify describes its Commerce for Agents stack — Catalog, Universal Cart and Checkout Kit — built to let AI agents shop across merchant stores, the same agentic-commerce capability Salesforce is building into Commerce Cloud.
And that's why we built the Commerce for Agents tools that we introduced on our last call, Catalog, Universal Cart and Checkout Kit. These tools make it easier for agents to shop across merchant stores on a buyer's behalf. But here's the thing. Agentic commerce is so much more than just the last click. Think about it in three layers: product discovery, purchasing experience and the post-purchase journey.
p. 2 · Read in context →
Shopify reports its B2B GMV up 98% year over year in Q3 FY2025 — evidence of its acceleration in the business-to-business commerce segment where it increasingly overlaps with Salesforce's B2B Commerce Cloud.
offline GMV increased 31% as we attract more retail-first brands globally. Our B2B GMV was up 98%, fueled by existing merchants embracing our offerings and our go-to market initiatives targeting more B2B specific verticals and merchants.
p. 6 · Read in context →
More peer documents
Q1_FY2026 — 16 pages · ServiceNow's latest call quantifies the CRM collision: CRM and industry workflows in 16 of its top 20 deals (driven by CPQ, sales and order management) and Now Assist on a trajectory toward a ~$1B ACV target — the sharpest deal-level overlap with Salesforce Sales/Revenue Cloud. · Open →
NOW_annual_report_FY2024 — 126 pages · Prior-year 10-K lays out ServiceNow's agentic-AI / Now Assist strategy (AI agents that act autonomously with human oversight), showing the Agentforce-style positioning predates the FY2025 CRM product-line formalization. · Open →
Q4_FY2025 — 13 pages · Adobe's Q4 FY2025 call for the latest Digital Experience segment results and agentic-AI (AEP Agent Orchestrator) commentary, a two-period read on the marketing-cloud rivalry with Salesforce. · Open →
ADBE_annual_report_FY2024 — 157 pages · Prior-year 10-K with the Digital Experience segment roster (Real-Time CDP, Journey Optimizer, Marketo Engage) and competition section — a before/after view of Adobe's marketing-cloud overlap with Salesforce ahead of its FY2026 single-segment reorganization. · Open →
Q4_FY2026 — 12 pages · Snowflake's most aggressive strategic claim — to be "the control plane for the agentic era" and a single enterprise-wide source of truth, with agents retiring whole categories of legacy software — plus full-year scale and TAM figures relevant to the Data Cloud contest. · Open →
SNOW_annual_report_FY2025 — 144 pages · Prior-year 10-K defining the AI Data Cloud and its single-source-of-truth vision, for a two-year read on how Snowflake frames the enterprise data layer that Salesforce Data Cloud also targets. · Open →
SHOP_annual_report_FY2025 — 135 pages · Shopify's 10-K risk language explicitly discusses the costs and longer cycles of moving "within the enterprise market" — the upmarket push into Salesforce Commerce Cloud's core large-merchant segment, alongside GMV and merchant-plan definitions. · Open →
Q2_FY2025 — 13 pages · Shopify's enterprise/upmarket logo wins (Starbucks, Miele, Signet Jewelers, a Unilever skincare brand, Tata) — concrete large-brand accounts of the type Salesforce Commerce Cloud has traditionally served. · Open →
Source: S&P Capital IQ consensus via Xpressfeed · Generated 2026-07-22.
Normalized EPS estimates up ~7% for FY2027 in 90 days while revenue sits flat
The FY2027 EPS revision landed within the last three months; the 30-day change is negligible, so the re-rating has paused for now. Revenue estimates for both years have barely moved.
Currency: USD · Scale: money in millions, absolute · Point-in-time consensus; Δ90d is Now versus 90d.
| Metric | FY | 180d | 90d | 30d | Now | Δ90d |
|---|---|---|---|---|---|---|
| EPS (normalized) | FY2027 | $13.20 | $13.20 | $14.13 | $14.13 | +7.1% |
| EPS (normalized) | FY2028 | $15.14 | $14.93 | $15.50 | $15.51 | +3.9% |
| Revenue | FY2027 | $46.15bn | $46.14bn | $46.10bn | $46.11bn | -0.1% |
| Revenue | FY2028 | $50.61bn | $50.57bn | $50.55bn | $50.51bn | -0.1% |
Normalized-EPS beats are accelerating - 14%, 25%, 24% - while revenue lands on the number
Current sequences by metric: Revenue: 2 consecutive beats; EPS (normalized): 6 consecutive beats.
Currency: USD · Scale: money in millions, absolute · Consensus is captured before each actual first became effective.
| Quarter | Metric | Consensus | Actual | Surprise | Outcome |
|---|---|---|---|---|---|
| Q1 FY2027 | Revenue | $11.06bn | $11.13bn | +0.7% | Beat |
| Q1 FY2027 | EPS (normalized) | $3.13 | $3.88 | +24.1% | Beat |
| Q4 FY2026 | Revenue | $11.19bn | $11.20bn | +0.1% | Beat |
| Q4 FY2026 | EPS (normalized) | $3.05 | $3.81 | +24.9% | Beat |
| Q3 FY2026 | Revenue | $10.27bn | $10.26bn | -0.1% | Miss |
| Q3 FY2026 | EPS (normalized) | $2.86 | $3.25 | +13.6% | Beat |
| Q2 FY2026 | Revenue | $10.14bn | $10.24bn | +1.0% | Beat |
| Q2 FY2026 | EPS (normalized) | $2.78 | $2.91 | +4.7% | Beat |
| Q1 FY2026 | Revenue | $9.75bn | $9.83bn | +0.8% | Beat |
| Q1 FY2026 | EPS (normalized) | $2.55 | $2.58 | +1.3% | Beat |
| Q4 FY2025 | Revenue | $10.04bn | $9.99bn | -0.4% | Miss |
| Q4 FY2025 | EPS (normalized) | $2.61 | $2.78 | +6.4% | Beat |
| Q3 FY2025 | Revenue | $9.35bn | $9.44bn | +1.0% | Beat |
| Q3 FY2025 | EPS (normalized) | $2.45 | $2.41 | -1.5% | Miss |
| Q2 FY2025 | Revenue | $9.23bn | $9.32bn | +1.0% | Beat |
| Q2 FY2025 | EPS (normalized) | $2.36 | $2.56 | +8.7% | Beat |
Consensus models ~10% revenue growth through FY2029 with EPS compounding faster
Currency: USD · Scale: money in millions, absolute · YoY uses the prior fiscal year from the feed; analyst count and range use the first displayed period.
| Metric | FY2026A | FY2027E | FY2028E | FY2029E | YoY | Analysts | Low / high |
|---|---|---|---|---|---|---|---|
| Revenue | $41.50bn | $46.11bn | $50.51bn | $55.28bn | +9.5% | 44 | $41.19bn / $41.62bn |
| EPS (normalized) | $11.77 | $14.13 | $15.51 | $17.95 | +15.4% | 44 | $11.50 / $11.92 |
Analysts split on the outer-year margin path: FY2028 EPS spans $14.25-$17.47
On 53 estimates the FY2028 normalized-EPS range runs $14.25-$17.47 around a $15.51 mean; by FY2029 it widens to $15.65-$19.27 on just 22 estimates, so the dispersion is as much about coverage thinning as conviction.
Currency: USD · Scale: money in millions, absolute · Spread/mean is absolute high-low divided by absolute mean.
| Metric | Period | Mean | Low–high | Spread/mean | Analysts |
|---|---|---|---|---|---|
| EPS (normalized) | FY2028E | $15.51 | $14.25–$17.47 | 20.8% | 53 |
| EPS (normalized) | FY2029E | $17.95 | $15.65–$19.27 | 20.2% | 22 |
Street snapshot
Currency: USD · Scale: money in millions, absolute · Analyst counts shown explicitly.
| Street view | Reading | Analysts |
|---|---|---|
| Recommendation mix | Buy 34, Outperform 5, Hold 12, Underperform 2, Sell 0 | 53 |
| Consensus score | 1.66 | 53 |
| Target price | mean $241.7; median $236.0; high $475.0; low $160.0 | 53 |
Visible Alpha broker models via S&P Xpressfeed · 37 brokers · 399 line items · freshest revision 2026-07-21.
The street models Salesforce as a durable low-double-digit subscription compounder with steadily expanding margins, but the growth is narrowing to one engine. The Platform & other cloud (Data Cloud and AI) carries the acceleration while Marketing & Commerce stalls, and much of the near-term reacceleration is acquired rather than organic. Backlog metrics keep compounding at double digits, giving good visibility, and free cash flow per share compounds faster than free cash flow itself as buybacks shrink the count. Coverage is deep on the P&L and cash lines but thin on the differentiated SaaS KPIs.
Platform & other is the modeled growth engine — +31% in FY-2027, overtaking Service
Platform & other passes Service to become the largest cloud in FY-2027 and stays there. By contrast Marketing & Commerce is modeled to grow only low-single-digits — a line the street effectively writes off — and Data is lumpy.
| Line | FY-2025A | FY-2026A | FY-2027E | FY-2028E | YoY | Brokers |
|---|---|---|---|---|---|---|
| Revenue - Platform and other | $7.19bn | $8.52bn | $11.19bn | $13.41bn | +31.4% | 24 |
| Revenue - Service | $9.10bn | $9.85bn | $10.58bn | $11.46bn | +7.5% | 24 |
| Revenue - Sales | $8.36bn | $9.03bn | $9.74bn | $10.30bn | +7.8% | 24 |
| Revenue - Data | $5.79bn | $6.46bn | $6.65bn | $7.35bn | +2.9% | 24 |
| Revenue - Marketing and Commerce | $5.30bn | $5.46bn | $5.54bn | $5.73bn | +1.5% | 24 |
Backlog still compounds double digits, but current-RPO growth is easing
Current RPO — contracted subscription revenue due within twelve months — is the cleanest read on future revenue; it keeps growing double digits but the pace eases from a mid-teens FY-2026 rate toward low double digits. Total billings, total RPO and deferred revenue keep a similar pace.
| Line | FY-2025A | FY-2026A | FY-2027E | FY-2028E | YoY | Brokers |
|---|---|---|---|---|---|---|
| Total revenue - Subscription and support | $35.74bn | $39.35bn | $44.04bn | $48.38bn | +11.9% | 36 |
| RPO - Current | $30.15bn | $34.58bn | $38.97bn | $43.06bn | +12.7% | 27 |
| Total RPO | $61.62bn | $70.74bn | $79.37bn | $84.50bn | +12.2% | 20 |
| Total billings | $39.43bn | $43.81bn | $48.67bn | $53.11bn | +11.1% | 33 |
| Total deferred revenue | $20.61bn | $23.10bn | $26.79bn | $29.36bn | +16.0% | 30 |
The Data-Cloud-led Platform ramp is where brokers most disagree
Consensus on total subscription revenue is tight; the real debate is how steep the Platform ramp gets. The spread widens sharply into FY-2028, where a handful of bulls stretch the range far above a tightly clustered core. Data shows the same pattern on a smaller base.
| Line | Period | Median | Q1–Q3 | Min–max | Brokers |
|---|---|---|---|---|---|
| Revenue - Platform and other | FY-2027E | $11.19bn | $10.44bn–$11.65bn | $9.57bn–$12.73bn | 12 |
| Revenue - Platform and other | FY-2028E | $12.91bn | $11.69bn–$14.15bn | $10.34bn–$18.24bn | 12 |
| Revenue - Data | FY-2028E | $7.25bn | $6.91bn–$7.72bn | $6.21bn–$9.38bn | 12 |
Steady margin expansion and buyback-boosted free cash flow per share
Operating margin grinds higher each year while gross margin holds near four-fifths of revenue — the story is operating leverage, not gross margin. Free cash flow per share climbs faster than free cash flow itself as buybacks reduce the share count.
| Line | FY-2025A | FY-2026A | FY-2027E | FY-2028E | YoY | Brokers |
|---|---|---|---|---|---|---|
| Operating margin(%) | 32.9% | 34.1% | 34.3% | 35.2% | +0.3pt | 37 |
| Gross margin - Operating(%) | 80.6% | 80.6% | 80.8% | 81.0% | +0.1pt | 33 |
| Free cash flow | $12.21bn | $14.09bn | $15.10bn | $16.29bn | +7.2% | 33 |
| Free cash flow per share($) | $12.53 | $14.68 | $17.77 | $19.38 | +21.1% | 32 |
The FY-2027 reacceleration is mostly acquired, not organic
Reported constant-currency growth steps up in FY-2027 while the brokers' organic-growth line eases, so the swing is inorganic. The driver is the Informatica subscription contribution, which jumps roughly fivefold year on year; strip it out and underlying growth is flat-to-down versus FY-2026. This is the differentiated read behind the headline reacceleration the CapIQ tab shows.
Deep on the financials, thin and single-broker on the SaaS KPIs
Total revenue, subscription, billings, margins and free cash flow carry 30-plus brokers and were revised through 2026-07-21. But ARR is a single-broker figure in the forward years, and renewal billings, renewal rate and churn each rest on one to four brokers — treat them as one analyst's view, not consensus. Product-cloud detail also thins to about 12-13 brokers for FY-2027/28, and a new Agentforce / Data 360 split (14 brokers, revised in late May) sits alongside the older cloud map.
Headline P&L consensus, momentum and beat/miss live in the CapIQ tab.
Source: S&P Capital IQ transcripts via Xpressfeed · latest indexed call 2026-05-27 · generated 2026-07-22.
Latest call digest
Salesforce, Inc., Q1 2027 Earnings Call, May 27, 2026 · 2026-05-27T21:00:00
Q1 FY2027 — May 27, 2026. Salesforce ran its second video earnings call, and the prepared remarks leaned heavily on staged customer testimonials (PenFed's James Schenck, UCLA Health) and Agentforce/Slack/Headless momentum rather than the numbers. Marc Benioff led with usage: 28.6 trillion tokens processed (up 152% quarter-over-quarter), 3.8 billion agentic work units, Agentforce ARR above $1 billion, $3.4 billion in combined AI and data ARR, and 98 deals over $1 million. Robin Washington framed the financials under a new FY27 disclosure structure: revenue of $11.13 billion (up 13% year-over-year, 12% constant currency, ahead of the guide), cRPO of $33.6 billion, non-GAAP operating margin of 34.8%, and $6.7 billion of operating cash flow, alongside a $25 billion accelerated share repurchase.
The Q&A was tightly managed — only five analyst questions were taken — and it surfaced the tension the script glosses over. Keith Weiss pressed the hardest: with cRPO merely in line for two straight quarters and Tableau and Commerce dragging, why the confidence in a second-half organic subscription reacceleration? Management pointed to net new AOV outpacing AOV growth and pipeline rather than the cRPO print itself. Gabriela Borges probed Headless 360's downside (value abstraction, in-house builds); Brad Zelnick asked how token/AWU usage translates to revenue without gross-margin erosion. On guidance actually stated: the FY27 revenue midpoint was raised to $45.9 billion to $46.2 billion, the 34.3% non-GAAP operating margin was reiterated, Q2 revenue was guided to $11.27 billion to $11.35 billion, and operating and free cash flow growth were cut to 4% to 5% on debt tied to the ASR.
Participant coverage from the latest call.
| Group | Participants | Count |
|---|---|---|
| Management | Operator; Michael Spencer — Executive Vice President of Investor Relations, Salesforce, Inc.; Marc Benioff — Co-Founder, Chairman & CEO, Salesforce, Inc.; James Schenck — President & CEO, Pentagon Federal Credit Union; Michael Burke; Pallavi Mynampati; Robin Washington — President, Chief Operating & Financial Officer and Director, Salesforce, Inc.; Miguel Milano — President & Chief Revenue Officer, Salesforce, Inc.; Patrick Stokes — President & Chief Marketing Officer, Salesforce, Inc.; Srinivas Tallapragada — President, Chief Engineering & Customer Success Officer, Salesforce, Inc. | 10 |
| Analysts | Brent Thill — MD & Tech Sector Equity Analyst, Jefferies LLC, Research Division; Keith Weiss — Equity Analyst, Morgan Stanley, Research Division; Gabriela Borges — Analyst, Goldman Sachs Group, Inc., Research Division; Brad Zelnick — MD of Software Equity Research & Senior US Software Research Analyst, Deutsche Bank AG, Research Division; S. Kirk Materne — Senior MD & Fundamental Research Analyst, Evercore ISI Institutional Equities, Research Division | 5 |
Curated latest-call exchanges; one row per analyst topic.
| Analyst | Firm | Topic | What changed in Q&A |
|---|---|---|---|
| Brent Thill | Jefferies | AI-led transformation signals | Opened by asking what excites Benioff beyond the Agentforce metrics and what pipeline signals investors cannot see; answered discursively on service/sales automation and Agentforce replacing Salesforce search rather than with new disclosures. |
| Keith Weiss | Morgan Stanley | cRPO vs Agentforce KPIs; back-half acceleration | The sharpest exchange. Noted cRPO was spot in line for two straight quarters with bookings lagging and Tableau/Commerce dragging, and asked where confidence in a second-half organic subscription reacceleration comes from. Management leaned on net new AOV outpacing AOV growth and pipeline. |
| Gabriela Borges | Goldman Sachs | Headless 360 monetization and downside | Asked how Headless expands the surface area without enabling value abstraction, in-house builds, or competitors. Management argued it drives knowledge-worker usage and deepens core-cloud dependence, but conceded the monetization model is still being worked out with customers and partners. |
| Brad Zelnick | Deutsche Bank | Usage-to-revenue translation and gross margin | Asked management to bridge fast-growing token/AWU usage to Agentforce revenue and to explain how gross margins hold despite surging token demand. Answer stressed flat engineering headcount, absorbing token cost into margin, and consumption-led monetization over time. |
| S. Kirk Materne | Evercore ISI | Slack as an agentic gateway | Asked whether Slack acts as a network-effect gateway for broader agentic adoption. Management described Slack as the engagement layer where humans and agents work together and cited it as nearly half of the quarter's $1 million-plus wins. |
Theme tracker
Themes are curator-classified across supplied calls.
| Theme | Status | Quarters mentioned | Read-through |
|---|---|---|---|
| Agentforce / the agentic enterprise | persisted | Q2 2025, Q3 2025, Q4 2025, Q1 2026, Q2 2026, Q3 2026, Q4 2026, Q1 2027 | The organizing narrative of every recent call, displacing the earlier Einstein framing. Disclosure has shifted from deal counts to usage (tokens, agentic work units) and ARR milestones, with the product repositioned from an add-on to the platform embedded across all clouds. |
| Data foundation (Data Cloud / Data 360 / Informatica) | persisted | Q2 2025, Q3 2025, Q4 2025, Q1 2026, Q2 2026, Q3 2026, Q4 2026, Q1 2027 | Consistently positioned as the prerequisite for accurate agents ('every AI transformation is a data transformation'). Data Cloud was rebranded Data 360 and the ~$8 billion Informatica acquisition was signed (Q1 2026) and folded in, building toward a stated ~$10 billion data layer. |
| Slack / Slackbot as the agent engagement layer | persisted | Q1 2026, Q2 2026, Q3 2026, Q4 2026, Q1 2027 | Elevated from a collaboration tool to the centerpiece of the employee-agent strategy. Management repeatedly cites AI-lab customers (OpenAI, Anthropic) and, by Q1 2027, claims Slack drove nearly half of the quarter's million-dollar wins. |
| Einstein predictive-AI branding | dropped | Q2 2024, Q3 2024, Q4 2024, Q1 2025, Q2 2025 | The dominant AI framing in FY24 and early FY25 calls; largely absent from Q4 2025 onward as Agentforce and the LLM-gateway narrative took over. Now referenced only historically as the company's pre-LLM model era. |
| Revenue reacceleration / net new AOV framework | emerged | Q3 2026, Q4 2026, Q1 2027 | Introduced around Investor Day as the bridge from bookings momentum to reported growth: net new AOV outpacing AOV growth is presented as the leading indicator of a second-half FY27 organic subscription reacceleration. It is the metric management now points to whenever cRPO disappoints. |
| Usage metrics (tokens, then agentic work units) | emerged | Q3 2026, Q4 2026, Q1 2027 | Tokens were foregrounded in Q3 2026, the Agentic Work Unit was introduced in Q4 2026, and both scaled sharply in Q1 2027. Presented as proof of real adoption, though analysts keep asking how the usage converts to revenue. |
| Capital return (buybacks, dividend, ASR) | persisted | Q4 2024, Q1 2025, Q1 2026, Q2 2026, Q3 2026, Q4 2026, Q1 2027 | From the first-ever dividend (Q4 2024) to a $50 billion repurchase authorization (Q4 2026) and a $25 billion accelerated share repurchase (Q1 2027). Framed explicitly as buying back stock at a 'dislocated' price; the ASR-linked debt trimmed FY27 cash-flow growth guidance. |
| Marketing, Commerce and Tableau softness | persisted | Q1 2026, Q2 2026, Q3 2026, Q4 2026, Q1 2027 | A recurring, candidly stated drag partially offsetting Agentforce/Data momentum. Tableau weakness deepened over time, with Q1 2027 citing increased softness in Tableau bookings and renewals on top of ongoing marketing and commerce weakness. |
| Headless 360 | emerged | Q1 2027 | A brand-new strategy in Q1 2027 exposing Salesforce via MCP so agents and coding tools can reach the platform from any surface. Presented as the next leg toward the FY30 target, though management conceded the monetization model is still being defined. |
Guidance ledger
Quotes, calls, and speakers are source-verified; outcomes are curator-classified.
| Verbatim guidance | Call | Speaker | Curator outcome | Outcome note |
|---|---|---|---|---|
| “We are pleased to raise the low end of our fiscal year '26 revenue guidance to $41.1 billion to $41.3 billion.” | Salesforce, Inc., Q2 2026 Earnings Call, Sep 03, 2025 · 2025-09-03T21:00:00 | Robin Washington | kept | FY26 subsequently closed at $41.5 billion in revenue, at/above the raised range per the Q4 2026 call. |
| “we remain on track to reaccelerate revenue in 12 to 18 months.” | Salesforce, Inc., Q3 2026 Earnings Call, Dec 03, 2025 · 2025-12-03T22:00:00 | Robin Washington | pending | Later sharpened to a second-half FY27 organic subscription reacceleration; not yet realized as of the Q1 2027 call. |
| “We expect revenue of $11.03 billion to $11.08 billion, growth of approximately 12% to 13% in nominal and 10% to 11% in constant currency.” | Salesforce, Inc., Q4 2026 Earnings Call, Feb 25, 2026 · 2026-02-25T22:00:00 | Robin Washington | kept | This Q1 FY27 guide was beaten: Q1 FY27 revenue came in at $11.13 billion per the following call. |
| “we're updating our fiscal year '30 revenue target to $63 billion.” | Salesforce, Inc., Q4 2026 Earnings Call, Feb 25, 2026 · 2026-02-25T22:00:00 | Marc Benioff | pending | Long-dated framework target (raised from $60 billion), reaffirmed on subsequent calls; outcome cannot be assessed from the supplied history. |
| “We are raising the midpoint of our FY '27 revenue guidance to $45.9 billion to $46.2 billion.” | Salesforce, Inc., Q1 2027 Earnings Call, May 27, 2026 · 2026-05-27T21:00:00 | Robin Washington | pending | Full-year FY27 guide raised after a Q1 beat; the fiscal year is not yet complete in the supplied history. |
| “We expect Q2 revenue of $11.27 billion to $11.35 billion, growth of approximately 10% in constant currency.” | Salesforce, Inc., Q1 2027 Earnings Call, May 27, 2026 · 2026-05-27T21:00:00 | Robin Washington | pending | Q2 FY27 guide issued on the latest call; no subsequent call in the supplied history to judge the outcome. |
Q&A pressure map
Question counts and firms are curator tallies; analyst coverage shown above.
| Topic | Questions | Firms | Pressure / response |
|---|---|---|---|
| When Agentforce KPIs translate into accelerating cRPO and reported growth | 4 | Morgan Stanley, Goldman Sachs | The most persistent line of questioning across the window. Keith Weiss pressed it in Q1 2026, Q4 2026 and Q1 2027 — noting cRPO merely met guidance for consecutive quarters while Agentforce metrics soared — and Kash Rangan asked the same inflection question in Q2 2026. Management consistently redirected to net new AOV as the leading indicator rather than reconciling the in-line cRPO directly. |
| SaaS disruption / build-vs-buy / model providers as competitors | 4 | Goldman Sachs, Morgan Stanley, Evercore ISI | Analysts repeatedly tested the bear thesis that AI-native or DIY builds and the LLM vendors themselves could displace Salesforce: Kash Rangan and Keith Weiss (Q2 2026), Kirk Materne on partner-vs-competitor lines with Anthropic/OpenAI (Q4 2026), and Gabriela Borges on Headless value abstraction (Q1 2027). Management's answer centered on the 'last mile' — context, data and deterministic workflows. |
| Monetizing usage (tokens/AWUs) and gross-margin impact | 3 | Goldman Sachs, Deutsche Bank, Evercore ISI | Gabriela Borges (Q4 2026) and Brad Zelnick (Q1 2027) asked how token and agentic-work-unit usage converts to revenue without eroding gross margin; Kirk Materne pressed on Agentforce pricing evolution (Q3 2026). Management pointed to premium SKUs, Flex Credits, AELAs and falling token costs, and characterized near-term gross-margin impact as neutral. |
| Capital allocation — buyback vs M&A | 2 | Jefferies | Brent Thill asked in both Q2 2026 and Q4 2026 whether the expanding buyback signals a shift away from M&A. Management framed a balanced approach across dividend, buyback, disciplined acquisitions and debt, arguing the stock was mispriced. |
| Sales capacity, AE ramp and productivity | 3 | Barclays, Bank of America | Raimo Lenschow (Q1 2026, Q2 2026, Q3 2026) and Brad Sills (Q3 2026) repeatedly probed the ~20%+ AE capacity build and whether ramping reps would be productive. Management tied it to renewed distribution investment after years of flat headcount and to pipeline growth. |
Language shifts
Only language evidence verified against the referenced component is shown.
| Observation | Verbatim evidence | Call ID | Component |
|---|---|---|---|
| Management adopted a defensive 'SaaSpocalypse' framing, pre-empting the thesis that AI erodes application software by casting it as a recurring, survivable market panic rather than a structural threat. | “This is not our first SaaSpocalypse. We have been through many SaaSpocalypses.” | 1982586281 | 2 |
| Confidence on the second-half reacceleration hardened from the Q3 2026 'very likely possibility in 12 to 18 months' to explicit certainty a quarter later, staking management credibility on the net-new-AOV trend. | “we are certain now because we've seen the net new AOV growth outpacing the AOV growth in H2 last year.” | 1982586281 | 95 |
| Caution on Tableau deepened over the window, moving from a general soft spot to an explicitly worsening drag on both bookings and renewals in Q1 2027. | “increased softness in Tableau bookings and renewals.” | 1999230054 | 34 |
The call history shows a company that has fully reorganized its story around Agentforce, with genuine, fast-growing usage to point to. The unresolved thread is conversion: for consecutive quarters cRPO has only met guidance while the eye-catching metrics accelerated, and management has answered by staking its credibility on a second-half FY27 reacceleration it now calls near-certain. Whether net new AOV actually pulls reported subscription growth up — against persistent Tableau, Marketing and Commerce softness — is the near-term test the transcripts set up.
The Cash Machine
Salesforce sells customer-relationship software by subscription and, since fiscal 2024, has turned a decade of hyper-growth into a high-margin cash engine: free cash flow reached $14.4 billion in the year to January 2026, up from $1.7 billion nine years earlier, and it has grown every single year in between. The share price tells the opposite story — down 54% from its December 2024 peak. This chapter orients a reader who is new to the name and fixes the question the rest of the report answers.
What the company is
Salesforce is the largest independent maker of customer-relationship management (CRM) software. It delivers its applications over the internet on a subscription basis, and reports as a single operating segment, drawing revenue from two sources: subscription and support, which was roughly 95% of the $41.5 billion total in fiscal 2026, and a small professional-services remainder [1]. Customers pay to access cloud services they never take possession of, and revenue is recognized ratably over the contract term [2].
The subscription base is spread across five product families — the company now brands them all under the "Agentforce" AI label, but the underlying franchises are the familiar ones: Service, Sales, Platform (including Slack), Integration and Analytics (MuleSoft and Tableau), and Marketing and Commerce.
Source: FY2026 Annual Report (Form 10-K), disaggregation of subscription and support revenue [3].
No single family is more than a quarter of the subscription mix, and the two oldest — Service and Sales — still account for the largest shares. Total subscription and support revenue was $39.4 billion, growing 10% year over year [4]. The business grew a large chunk of that footprint by acquisition — Slack, Tableau, MuleSoft, and most recently Informatica — a strategy that shows up on the balance sheet as $58 billion of goodwill, discussed below.
The two curves that define the case
Salesforce's history splits into two lines that diverged in fiscal 2024. Revenue compounded at roughly 19% a year across the decade — from $8.4 billion in fiscal 2017 to $41.5 billion in fiscal 2026 — but for most of that period the company converted almost none of it into reported operating profit, running GAAP operating margins between 2% and 4% while it spent to grow. Then the margin line broke upward: operating margin went from 3.3% in fiscal 2023 to 20.1% in fiscal 2026.
Source: derived from reported financials, FY2017–FY2026 Forms 10-K [5].
The turn was deliberate. Management describes "various restructuring initiatives to improve operating margins," including headcount reductions, as an explicit "commitment to profitable growth" [6]. That pivot — from growth financed at any cost to margin discipline — is the change that reshaped the cash line, and it is the reason that line looks the way it does.
Cash conversion
For a business that recognizes revenue over multi-year contracts and collects much of it upfront, the cash statement matters more than the income statement. Salesforce's is unusually clean. Capital expenditure is trivial — about 1.4% of revenue — because customers run on infrastructure the company largely rents, so free cash flow tracks operating cash flow closely and has risen every year for a decade, through the pandemic, the growth slowdown, and the restructuring.
Source: derived from reported financials, FY2017–FY2026 Forms 10-K, Consolidated Statements of Cash Flows. Capital expenditure averaged under 2% of revenue [7].
Ten consecutive years of rising free cash flow, compounding at about 27% a year, is the kind of consistency a cash-flow-focused investor looks for first. Two cautions belong in the same breath. The gap between the 20% GAAP operating margin and the 35% free-cash-flow margin is largely stock-based compensation, a real cost to shareholders that cash flow flatters — a thread later chapters take up. And the smoothness owes something to the subscription model's prepaid, deferred-revenue mechanics, which the balance-sheet chapter should test rather than take on faith.
What management does with the cash
The company began returning capital in fiscal 2023 and has scaled it quickly. The Board's repurchase authorization now totals $50 billion, expanded by $20 billion in September 2025; in fiscal 2026 alone Salesforce bought back $12.7 billion of stock and, since the program began, has returned close to $27 billion through buybacks and dividends [8] [9]. A dividend, initiated in fiscal 2025, was raised to $0.44 per share declared in February 2026 [10].
Source: FY2026 Annual Report (Form 10-K), Share Repurchase Program and Dividend Policy [11] [12].
The buybacks have started to shrink the share count — from a peak near 997 million in fiscal 2023 to about 923 million by February 2026 [13]. The counter-fact a skeptic should hold onto: the $12.7 billion of fiscal-2026 repurchases were done at an average price of $254.21 [14] — roughly 49% above where the stock trades today. The commitment to shrinking the count is real; the price paid so far has not been opportunistic.
The dislocation
That is the setup a value investor is handed. Over the two and a half years to July 2026 the operating results improved on every axis that matters — revenue up, operating margin rose roughly sixfold, from about 3% to 20%, and free cash flow more than doubled since fiscal 2023 — while the stock did this:
Source: daily price history; fiscal-2026 figure is the 17 July 2026 close of $170.77. December 2024 intraday-close peak was $367.87.
At $170.77 the stock sits 54% below its December 2024 peak. On the roughly 923 million shares outstanding that is a market capitalization near $158 billion; against $14.4 billion of trailing free cash flow, a free-cash-flow yield of about 9.1%, or 8.7% on enterprise value once the modest $7.1 billion of net debt is added — leverage of about half a year's free cash flow.
Market Cap
Free Cash Flow (FY26)
FCF Yield
Net Debt / FCF
Source: FY2026 Form 10-K (net debt, shares outstanding [15]); market cap and yields derived at the 17 July 2026 close of $170.77.
Whether that yield is cheap or a value trap turns on durability, and there are two anchors on either side of that question. In its favor: $72.4 billion of remaining performance obligation — revenue already under contract but not yet recognized — sat on the books at year-end, up 14% year over year and equal to about 1.7 years of revenue [16]. Against it: subscription growth has slowed to 10%, the company itself flags that new AI offerings "may disrupt our service offerings" [17], and $58 billion of goodwill means tangible book value is deeply negative — the acquisitions have to keep earning their price.
The question this report answers
A professional investor meeting Salesforce for the first time now has the shape of it: a subscription software franchise with recurring, prepaid economics, an asset-light cash profile, a management team two years into a genuine margin-and-returns discipline, and a stock the market has cut in half. The thread that runs through every chapter to come is this:
Is Salesforce's CRM franchise durable enough — against decelerating subscription growth and an unsettled shift to AI agents — to keep compounding free cash flow, so that the cash it generates a decade from now is reliably larger than the roughly $14 billion it produces today? Everything else — the moat, the deferred-revenue mechanics, the stock-based compensation, the acquisition record, and what the halved price now implies — is evidence for or against that one durability question.
Switching Costs
The cash machine (The Cash Machine) only compounds if customers stay. They do: Salesforce loses roughly eight percent of contract value to attrition each year, and that rate has barely moved for four years — through a demand slowdown, a restructuring, list-price increases, and the arrival of AI. That is the clearest evidence the base is durable. The complication sits beside it: over the same four years revenue growth halved, from the mid-twenties to about nine percent. The moat holds the base; it is not holding the growth rate.
A retention rate that will not move
Salesforce defines attrition as "the reduction or loss of the annualized value of our contracts with customers," measured on a trailing-twelve-month basis [1]. As of January 31, 2026 that rate, excluding Slack self-service and current-year acquisitions, was "approximately eight percent" — and management notes it stayed "consistent as compared to the prior year" [2].
The consistency is the point. Attrition was below 7.5 percent at January 31, 2023 on a narrower base that excluded MuleSoft, Tableau and Slack [3]. MuleSoft and Tableau were folded into the calculation from fiscal 2024, and the rate settled at approximately eight percent at January 31, 2024 [4] and again at January 31, 2025 [5]. An eight percent annualized loss implies the installed base renews at roughly 92 percent of its value each year before any upsell — a high floor for a business whose contracts typically run 12 to 36 months.
Revenue growth derived from reported revenue, FY2022–FY2026 10-Ks; attrition as disclosed. The FY2023 attrition point sits on a narrower base (excludes MuleSoft, Tableau, Slack). Sources: attrition [6][7][8][9]; revenue growth derived from reported financials.
The red line is nearly flat while the blue one falls by more than half. The two lines separate two questions that are easy to conflate: whether customers leave (they largely do not) and whether the business is still expanding quickly (less so). The revenue base is also broad — no single customer accounted for more than ten percent of revenue in any of fiscal 2024, 2025 or 2026 — so the retention figure is not propped up by a few large accounts [10].
What locks customers in
The retention number is a symptom; the mechanism is switching cost. Salesforce's own risk disclosure describes it plainly: prospective customers "have invested substantial personnel and financial resources to implement and integrate their current enterprise software into their businesses and therefore may be reluctant or unwilling to migrate away from their current solution" [11]. Written as a risk to winning new logos, it is equally a description of why existing customers stay: the same integration cost that deters a switch to Salesforce deters a switch away from it.
Two design choices deepen that cost. The first is the ecosystem: third-party developers and independent software vendors build applications that "can be marketed and sold on the AppExchange, our enterprise cloud marketplace," so a customer's Salesforce deployment accretes bespoke apps and integrations that do not travel to a rival [12]. The second is multi-cloud adoption: management states that customers who adopt multiple service offerings "drive higher annual revenues and have lower attrition rates than our company average" [13]. Each additional cloud a customer runs raises the cost of unwinding — the data gravity compounds.
A single peer point frames how strong ~92 percent gross retention is in absolute terms. ServiceNow — a genuine enterprise-SaaS adjacency named among the platform competitors Salesforce faces — reported a renewal rate of 98 percent for each of 2023, 2024 and 2025 [14]. The metrics are not identical — a renewal rate counts contract value retained at renewal, while Salesforce's attrition captures annualized value lost across the whole book — so the two are directional, not strictly comparable. The read is that Salesforce's stickiness is high but not best-in-class among the stickiest enterprise-software franchises.
A caution on the peer set: the indexed competitors here (Adobe, ADP, ServiceNow, Shopify, Snowflake, Uber) are a screened, imperfect match. Salesforce's true CRM rivals — Microsoft Dynamics, Oracle, SAP, HubSpot — are not in this corpus, so a full share-shift comparison is not available from the filings on hand. Only ServiceNow and, partially, Adobe run a comparable subscription-platform model; the retention comparison is limited to that.
The contracted book ahead
Retention shows up a second way, on the balance sheet, as revenue already sold. Remaining performance obligation — all future revenue under contract not yet recognized — stood at $72.4 billion at January 31, 2026, up 14 percent from $63.4 billion, against $24.3 billion of unearned (deferred) revenue [15]. Roughly $35.1 billion of that book is expected to convert to revenue within the next twelve months [16].
FY2026 Attrition Rate
Implied Gross Retention
RPO ($B)
Revenue Under Contract (x)
Attrition and RPO as disclosed; implied gross retention (100% − attrition) and revenue-under-contract (RPO ÷ FY2026 revenue of $41.5B) derived from reported financials. Sources: attrition [17]; RPO [18].
At about 1.7 times fiscal 2026 revenue under contract, the forward book is a second buttress under the durability question: even before a single new deal, a large share of the next few years' revenue is already signed. The composition and cash quality of that deferred balance — how much of the cash-flow smoothness is prepayment timing rather than earnings — is its own subject and sits with a later chapter; here it functions as evidence that the base is not only sticky but pre-sold.
Where the moat stops
The same evidence bounds the claim. Three facts cut against reading the moat as a growth engine.
First, the arithmetic of the chart above: attrition held near eight percent while revenue growth fell from about 25 percent in fiscal 2022 to roughly 9 percent in fiscal 2026. A moat that keeps customers does not, on its own, keep the top line compounding at its old pace — the retention floor is high, but the expansion above it (new logos plus net upsell) has decelerated sharply. Durability of the base and durability of the growth rate are different properties, and the filings support the first far more cleanly than the second.
Second, the reported ~8 percent is a curated figure: it excludes Slack self-service and current-year acquisitions [19]. Those are the cohorts most prone to churn, so the blended, all-in loss rate is somewhat higher than the headline. The direction of the disclosure — steady, excluding the weakest customers — is favorable; the precision is not absolute.
Third, management names the mechanism that could erode switching costs over a decade. Its own competition risk factor warns that "New AI offerings may disrupt our service offerings," in a market it calls "highly competitive, rapidly evolving and fragmented" with "low barriers to entry" [20], and describes competition as "intensely competitive" where AI-native entrants could bypass established workflows [21]. If an AI agent can sit on top of a company's data without the years of integration that lock a customer into a system of record, the switching cost that produces the eight percent attrition weakens. Salesforce's answer has partly been to buy the capability — its October 2025 acquisition of Regrello and November 2025 acquisition of Informatica were framed as accelerating its "agentic roadmap" [22] — which keeps the platform current but shifts more of the growth from organic to acquired.
On the evidence, the moat is wide where it is measured. Four years of ~8 percent attrition through a downturn, a $72.4 billion contracted book, and rising switching costs from ecosystem and multi-cloud lock-in make a strong case that the installed base is durable — which is most of what the ten-year-revenue question needs. What the filings do not yet settle is whether that durability defends the growth rate against AI-native competition, or only the base. Attrition would be the first number to move if the switching cost thins. It has been the franchise's steadiest number, and the first sustained move above eight percent — particularly if it coincides with AI-native displacement rather than macro softness — would be the earliest sign of that.
Cash Quality
Salesforce turns reported profit into cash at roughly twice the rate of net income, and free cash flow has risen for ten straight years. The quality is real but not pristine: about $3.5 billion of that cash-over-profit gap is stock-based compensation, a genuine cost paid in dilution. And in March 2026 the company borrowed $25 billion to buy back stock, moving a near-net-cash balance sheet to about two times free cash flow of net debt. Customer prepayments, not borrowings, still fund the operation.
Earnings that become cash
Salesforce's cash-flow record is consistent. Operating cash flow and free cash flow have each risen every year for a decade, through the FY2020 profit trough, the FY2022–FY2023 growth slowdown, and the FY2024 restructuring. Free cash flow went from $1.7 billion (FY2017) to $14.4 billion (FY2026) without a single down year [1]. Because capital expenditure runs near 1.4% of revenue, operating cash flow and free cash flow track each other closely — this is a business where heavy capex does not depress the free-cash-flow line, so the consistency the reader looks for is not being flattered by an under-investment choice that will reverse.
Source: Consolidated statements of cash flows and operations, FY2017–FY2026 10-Ks; FY2026 figures per the FY2026 10-K [2].
In FY2026, operating cash flow of $15.0 billion was 2.0 times net income of $7.5 billion, and free cash flow of $14.4 billion was 1.9 times [3]. A conversion rate that high is not, by itself, a mark of quality — it has to be explained. Three items do most of the work: $3.6 billion of depreciation and amortization (much of it amortization of intangibles from past acquisitions), $3.5 billion of stock-based compensation, and a $2.9 billion increase in unearned revenue [4]. The first two are non-cash charges the cash-flow statement adds back; the third is customers paying ahead. None of them is an aggressive accrual, but two of them mean the cash figure sits above true economic earnings.
The stock-compensation wedge
Stock-based compensation is the item that most separates Salesforce's cash from its economics. The $3.5 billion charged in FY2026 is 8.5% of revenue [5]. Cash flow adds it back because no cash leaves the company when equity vests — but shareholders still pay for it, in dilution. Subtract it from free cash flow and the FY2026 figure falls from $14.4 billion to about $10.9 billion, and the roughly 9% headline free-cash-flow yield established in The Cash Machine drops to close to 7% — below the 8% threshold a cash-focused buyer typically wants.
Reported FCF ($B)
Stock-Based Comp ($B)
FCF less SBC ($B)
SBC-Adj. FCF Yield
Source: FY2026 10-K, statement of cash flows [6]; yield derived against the ~$158 billion market value in The Cash Machine.
The counter to that adjustment matters as much as the adjustment itself. Salesforce is not letting the share count drift upward: repurchases have exceeded the dilution, so the stock-compensation cost is being paid for in cash through buybacks rather than borne silently by holders. That is a better outcome than most software companies deliver, and it connects directly to the balance-sheet change below. But the accounting is unambiguous — the true owner-cash yield on this business is nearer 7% than 9%, and a reader who takes the reported free-cash-flow figure at face value is crediting Salesforce with about $3.5 billion of cash that is, in substance, a wage bill settled in shares. Seen whole, the compensation wedge and the balance-sheet swing are two sides of one trade: The market prices Salesforce's free cash flow to grow near zero forever, but that cash flow is overstated by ~$3.5B of add-back stock compensation — leaving a ~7-8% true owner-yield — and management met the low price by borrowing $25B to repurchase stock at $198.34, above today's ~$171, levering a near-net-cash balance sheet to ~2.1x free cash flow.
Deferred revenue: float, not debt
The item that makes Salesforce's cash consistent rather than lumpy is unearned revenue — customer prepayments for subscriptions not yet delivered. At January 31, 2026 the balance was $24.3 billion, equal to about 214 days of revenue and far above the 30-day level at which a deferred balance starts to read as a genuine forward-demand signal [7]. It is also growing: billings ran to $45.1 billion in FY2026, up 13.8% year on year and ahead of the 9.6% reported revenue growth [8]. Roughly half of all revenue recognized in FY2026 came out of the unearned balance carried into the year [9]. Billings running ahead of revenue is a modest positive: the book of paid-for, not-yet-delivered service is expanding faster than the income statement.
Source: FY2026 10-K, unearned revenue rollforward [10] and consolidated balance sheet [11].
A specific reader question — whether the net-debt calculation should treat deferred revenue as debt — resolves cleanly: the answer is no, because unearned revenue is discharged by delivering software the company already runs at near-zero incremental cost, not by paying cash. It is interest-free customer float. The right way to see it is that Salesforce runs on negative working capital: customers fund the business in advance. If one wrongly added the $24.3 billion of unearned revenue to borrowings, reported net debt would balloon past $30 billion; that would misread a funding advantage as a liability.
Salesforce's net-debt figure excludes the $24.3 billion of unearned revenue, and correctly so — that balance is a customer prepayment settled by performance, not a cash obligation. It is a source of interest-free financing, not a form of debt.
The balance sheet just changed
For most of the past decade Salesforce carried little net debt; at January 31, 2025 it held slightly more cash and equivalents than borrowings [12]. Two events changed that. In November 2025 the company drew $6 billion of bank debt to help fund the roughly $9.3 billion cash acquisition of Informatica [13]. Then in March 2026 it issued $25.0 billion of new senior notes and used the net proceeds to fund a $25 billion accelerated share repurchase, while refinancing the Informatica bridge with a $6 billion term loan [14]. Total debt principal went from $14.5 billion at January 31, 2026 to $39.5 billion by April 30, 2026 [15].
Source: FY2026 10-K balance sheet [16] and Q1 FY2027 10-Q balance sheet and debt note [17]. Net debt is total debt less cash and equivalents; including marketable securities trims it by roughly $3 billion.
The result, as of April 30, 2026, is net debt of about $30 billion against cash and equivalents of $8.9 billion — roughly 2.1 times FY2026 free cash flow, or nearer 1.9 times counting marketable securities [18]. That is a real change from the fortress balance sheet described at the year-end snapshot, but it sits inside the leverage a high-free-cash-flow business can carry: interest on the enlarged debt load runs to roughly $1.8 billion a year against $8.3 billion of operating income and $14.4 billion of free cash flow, so coverage falls from about 26 times to roughly 5 times operating income — lower, not stretched [19].
The buyback that drove this is aggressive on price as well as size. The accelerated repurchase delivered about 103 million shares at an average $198.34, cutting shares outstanding from 929 million to 819 million in a single quarter [20] and lifting quarterly diluted earnings per share to $2.42 from $1.59 a year earlier [21]. The $198.34 average was struck well below the December-2024 peak but still above the ~$171 the shares fetched by mid-2026 — the same pattern seen in the FY2026 open-market buybacks: management is shrinking the count and exploiting the selloff, but has not been buying at the lows.
The shape of the debt
The duration of that debt is barbelled, and the two ends were financed in very different worlds. The $8.5 billion of notes issued in 2021 carry coupons of 1.50% to 3.05% and run out to 2061 — cheap, long money locked in at the bottom of the rate cycle, worth only about $6.7 billion at year-end fair value [22]. The March-2026 tranche, by contrast, was priced at 4.50% to 6.70% across maturities from 2028 to 2066 [23]. There is very little near-term repayment pressure: only $6 billion matures before 2029, comfortably inside a single year's free cash flow.
Source: Q1 FY2027 10-Q, debt note; 2021 vintage carries 1.50%–3.05% coupons, the 2026 vintage 4.26%–6.70% [24].
Days, receivables and current liabilities
Two of the reader's forensic checks — a rise in days-sales-outstanding, and a build-up of current liabilities — flag on the year-end numbers and then dissolve on inspection. Receivables of $14.3 billion at January 31, 2026 were up 20% on a year when revenue grew 9.6%, lifting year-end days-sales-outstanding to about 126 days from 115 [25]. Taken alone that looks like slowing collections. It is not: Salesforce bills disproportionately in its January-ending fourth quarter, so the balance-sheet date catches receivables at their seasonal peak, and the first quarter is its largest collection quarter [26]. The proof is in the next quarter: by April 30, 2026 receivables had fallen to $5.1 billion, a $9.4 billion collection in three months [27].
Source: FY2026 10-K balance sheet [28] and Q1 FY2027 10-Q balance sheet [29].
The current-liability build tells the same seasonal-and-structural story. Total current liabilities rose from $28.0 billion to $37.1 billion over FY2026, but the increase is not a stretch of supplier payables: roughly $4 billion was the Informatica bridge loan reclassified as current, about $3.6 billion was the growth in unearned revenue already discussed, and the rest was accrued compensation and acquired liabilities [30]. By April 30 the figure had fallen back to $27.5 billion as the bridge was refinanced into long-term debt [31]. There is no days-sales-of-inventory to track — a software company holds no inventory — and no sign of payables being stretched to manufacture cash flow.
What the book value does and doesn't say
One balance-sheet lens the reader asks for — tangible book value — returns almost nothing here, and the reason is itself the finding. Of $112.3 billion in total assets at January 31, 2026, $57.9 billion is goodwill and a further $6.8 billion is acquired intangibles: together 58% of the balance sheet is the accounting residue of acquisitions — Slack, MuleSoft, Tableau, and now Informatica [32]. Strip those soft assets out and tangible common equity is negative — roughly minus $5.6 billion — so a tangible price-to-book multiple is not a meaningful gauge for this company. The intangibles amortize over a weighted 5.4-year life and flow through the depreciation-and-amortization add-back that inflates the cash-conversion ratio [33]. Salesforce has not recorded a goodwill impairment; it tests the balance annually in its fourth quarter [34].
Book value understates rather than overstates this business: the assets that matter — a recurring, prepaid contract base and the software behind it — are worth far more than their carrying value, while the goodwill that dominates the balance sheet is worth whatever the acquired revenue keeps earning. For a subscription compounder, price-to-free-cash-flow is the lens that works; tangible book is not. What the reader should carry forward from this chapter is narrower and firmer: the cash is real and unusually consistent, it flatters economic earnings by about $3.5 billion of stock compensation a year, the deferred-revenue float is a funding asset rather than a debt, and the balance sheet has just traded a decade of net-cash conservatism for roughly two times free cash flow of net debt in the service of buying back its own shares.
Growth and Agentforce
With revenue growth now in the high single digits — the deceleration traced in Switching Costs — management has staked its next five years on artificial intelligence reversing the trend. The evidence so far is real but early: an "Agentforce and Data 360" annual recurring revenue base that reached $2.9 billion at fiscal-2026 year-end — up from about $0.9 billion a year earlier, but still only about 7% of revenue. Whether that base scales fast enough to lift the whole company back to sustained double-digit growth is the open part of the durability case.
A decelerating engine, and a target to re-accelerate it
For most of the past decade Salesforce grew revenue at 18% to 25% a year. That rate roughly halved into fiscal 2026: revenue rose 9.6% to $41.5 billion [1], and sell-side consensus has fiscal 2027 near 11% and fiscal 2028 back to roughly 9.6%. The deceleration is not a leakage problem — attrition held near 8% and the contracted book kept growing (the retention floor documented in Switching Costs) — it is an expansion problem: new-logo and upsell growth no longer outrun the law of large numbers on a $41 billion base.
Source: FY2026 10-K Consolidated Statements of Operations for FY2021–FY2026 [2]; FY2027E–FY2028E are consensus estimates.
Against that backdrop, at its October 2025 Investor Day Salesforce set a new long-term goal: revenue of $60 billion or more by fiscal 2030, excluding the Informatica acquisition — a target it frames as "10%+ organic" compound annual growth from fiscal 2026 [3]. Getting from $41.5 billion to $60 billion over four years requires a roughly 9.7% CAGR, so the target is less a promised acceleration than a promise to hold the current pace for half a decade while the mix shifts toward AI. Management pairs it with a "Profitable Growth Framework" — subscription growth plus non-GAAP operating margin summing to 50 by fiscal 2030 [4].
FY2026 Revenue Growth
FY2030 Revenue Target ($B+)
Implied FY26–30 CAGR
Source: FY2026 revenue growth derived from the FY2026 10-K [5]; FY2030 target and implied CAGR from the Investor Day press release [6].
Where growth actually comes from now
The single-segment income statement hides an important split. Broken out by product family, the mature clouds that built Salesforce — Sales and Service — each grew about 8.4–8.5% in fiscal 2026, and Marketing & Commerce nearly stalled at 2.8%. The one product family growing at a genuinely different rate is Platform & Other, up 22.6% — the bucket that houses Slack, Data Cloud and the emerging Agentforce revenue [7].
Source: derived from FY2026 10-K revenue by service offering, FY2025 vs FY2026 [8].
In the MD&A management attributes fiscal-2026 momentum specifically to "Agentforce, Slack and Data 360" [9]. The read is that Salesforce's growth has become concentrated: roughly two-thirds of revenue (Sales, Service, Marketing) is compounding in the high-single digits at best, and the case for re-acceleration rests almost entirely on the newest, smallest layer scaling into something large.
The AI franchise: real, fast, and still small
That newest layer is now measurable. Salesforce reports an AI-and-data recurring-revenue metric — most recently "Agentforce & Data 360 ARR" — that it began disclosing as the products crossed the billion-dollar mark. At fiscal-2025 year-end (January 2025) it stood at about $900 million, growing 120% year-over-year, alongside 3,000 paying Agentforce customers just 90 days after launch [10]. By mid-fiscal-2026 the combined Data-and-AI figure reached $1.2 billion (again +120%), of which the narrower "agentic AI" slice was about $440 million, and Agentforce customers had grown past 12,000 [11]. By fiscal-2026 year-end (January 2026) the metric reached $2.9 billion, a figure disclosed not in the MD&A but in the proxy, because it was the payout trigger for management's new performance options [12].
Sources: $0.9B at Jan-2025 and +120% growth from the Q4 FY2025 call [13]; $1.2B at Jul-2025 (Q2 FY2026) from the Investor Day release [14]; $2.9B at Jan-2026 from the 2026 proxy [15].
Two facts matter here in tension. The growth rate is extraordinary — roughly a tripling in a year — and the base is trivial: $2.9 billion is about 7% of Salesforce's $41.5 billion of revenue, and the pure "agentic" component is nearer 1%. A product line tripling off a 7% base moves the consolidated growth rate only slowly; for AI to add even two points to company growth, it must contribute roughly $0.8 billion of net-new revenue a year and keep accelerating. The direction is unambiguous; the question is duration and slope.
Management has removed any doubt about how seriously it takes the number by tying its own pay to it. The fiscal-2026 long-term incentive plan introduced performance stock options for every named executive, earned only on "Agentforce & Data 360 ARR" — and only valuable if the stock also clears a $280.62 strike [16]. The ARR came in at $2.9 billion against a $2.0 billion "maximum" goal, so that half of the award vested at 200% of target [17]. The $280.62 strike, set well above the roughly $171 the shares fetch in mid-2026, is worth holding onto: management has already hit its AI-adoption bogey, but the equity that reward rides on is underwater until the stock rises about 64%.
Consumption pricing: the monetization mechanism, and its two edges
Agentforce and Data 360 are sold differently from Salesforce's classic per-seat subscriptions — through a consumption-based model, where customers pay for usage rather than a fixed number of licenses [18]. That design is a direct answer to the loudest bear argument against enterprise software: if AI agents let customers do more with fewer employees, a business priced per human seat should shrink. On the Q3 fiscal-2026 call an analyst put exactly that concern to management — the "very big mismatch" between investors expecting generative AI to be "injurious to the SaaS application layer" and the inflection Salesforce claims to see [19]. Consumption pricing is how Salesforce intends to grow revenue "even in a stable or declining headcount situation": value is billed on agent activity, not employee count [20].
The same mechanism cuts the other way, and Salesforce says so plainly. The company has "limited experience with determining optimal pricing" for consumption contracts, and describes the markets and monetization strategies for Agentforce and Data 360 as "relatively new and uncertain" [21]. More pointedly, its most recent 10-Q warns that "AI-driven consumption models may make it more difficult to optimize our pricing, predict attrition rates, and accurately forecast revenue" [22]. The switching-cost moat that made Salesforce's revenue so predictable was built on multi-year seat subscriptions; a shift toward usage-based billing trades some of that predictability for a larger addressable wallet. That is a defensible trade, but it does give up some predictability.
Re-acceleration signals
Because reported growth has not yet inflected — the fiscal-2026 subscription guide was about 9% in constant currency, plus roughly 80 basis points from Informatica — the case rests on leading indicators [23]. Three are worth watching. First, current remaining performance obligations: organic cRPO was guided to about 9% constant-currency growth for the fourth quarter, with management stating it remains "on track to reaccelerate revenue in twelve to eighteen months" [24]. Second, consumption re-ups: management said 362 customers "refilled the tank" on Agentforce usage in a single quarter, up from three a year earlier — early evidence that usage-based revenue can recur and expand [25]. Third, large structured deals: Salesforce closed 16 multi-year "Agentic Enterprise License Agreements" in the quarter, with roughly 100 more in the pipeline, each a multimillion-dollar commitment [26].
On the reader's underlying question — can you say with high confidence that revenue a decade out will be higher than today — the direction and the rate should be separated. Direction is close to settled: with attrition near 8%, a $72 billion contracted book, and Agentforce driving usage re-ups rather than one-time sales, revenue would have to fall through a retention floor that has held for four years to end lower in ten years. Outright decline is a low-probability outcome. The rate is the genuine uncertainty. The $60 billion fiscal-2030 target is a bet that AI converts a maturing, high-single-digit core into a sustained 10%-plus compounder; today that bet is supported by a franchise growing 100%-plus but still only about 7% of revenue, and contradicted by reported growth that has been stuck near 9% for three years.
The most honest read is that the base is durable and the slope is not yet proven. What would move it toward the bull case is sustained organic cRPO re-acceleration above roughly 11–12% in constant currency, or the Agentforce-and-Data-360 line crossing into the mid-teens as a share of revenue — either would show AI adding points to the top line rather than merely growing fast in the corner of it. The clearest counter-evidence is already on the page: management has been forecasting re-acceleration for several quarters while the reported number has not moved, and by its own admission consumption pricing makes that number harder to predict, not easier.
Growth has decelerated to about 9–10%. The re-acceleration case rests on an AI franchise ($2.9B ARR, roughly 7% of revenue) tripling annually, monetized through consumption pricing that Salesforce itself calls "new and uncertain." The installed base makes higher revenue in a decade very likely; the rate of growth, and the $60B FY2030 target, remain unproven.
Competition
In the market as it has been defined for a decade, Salesforce is not just the leader — its lead is widening. It holds roughly a fifth of worldwide CRM-application revenue, close to five times its nearest rival. Whether that market is still where the contest will be decided is the less settled question. The contest is moving toward autonomous agents, where the distribution advantage tilts toward Microsoft's installed base, and where Salesforce's own 10-K now names, for the first time, rivals built to "displace established user interfaces." The moat holds the seat-based base; the shift to agentic software is real and unsettled.
The incumbent market: a widening lead
Salesforce competes in a market its own 10-K calls "highly competitive, rapidly evolving and fragmented, and subject to changing technology with low barriers to entry" [1]. That framing is honest about the threat surface, but it understates where Salesforce actually sits today. On IDC's measure of the CRM-applications market — the category the company was built to own — Salesforce held about 20.0% of worldwide revenue in 2025, its thirteenth consecutive year at the top and more than four times the share of its closest competitor.
Source: IDC Semiannual Core AI Software Tracker, H2 2025, worldwide CRM-applications revenue share — as reported by IDC; not in the filing corpus.
Two things follow from this shape. The lead is not a rounding advantage: at 20.0% against Oracle's 4.1% and Microsoft's 4.0%, Salesforce earns more CRM revenue than its next several rivals combined, and the gap has been widening, not closing, for over a decade. And the incumbents most often named as threats — Microsoft, Oracle, SAP — are, in the CRM category proper, minor. None appear in Salesforce's indexed peer set at all; the auto-selected comparables (ServiceNow, Adobe, Snowflake, plus Shopify, Uber and ADP) are enterprise-software adjacencies, not CRM rivals, so the competitive picture has to be assembled from Salesforce's own filings and outside data rather than the peer folder.
The point for a durability investor is narrow but real: within the game as scored today, no rival is close enough to take the installed base by direct competition. That is the evidence behind the switching-cost floor established earlier (Switching Costs). It is also why the more consequential threat is not a share war in CRM but a change in what customers are buying.
The new arena: where agentic budgets are landing
The reset is a shift from software priced by the seat to software priced by the task an agent performs. In that arena the scoreboard looks different, because the entry point is distribution, not CRM share. The clearest contrast is Microsoft. Its overall AI business was running at roughly a $37 billion annualized rate by the quarter ended March 2026, up about 123% year over year, and Microsoft 365 Copilot alone reached about 15 million paid seats — on the order of $5.4 billion of annual revenue at list — sold into an installed base of some 450 million Microsoft 365 seats. Salesforce's Agentforce, by contrast, crossed roughly $1 billion of annual recurring revenue in early fiscal 2027, growing faster in percentage terms but from a base several times smaller, and the broader Agentforce and Data 360 franchise stood near $2.9 billion (Growth and Agentforce).
Sources: company disclosures as reported (Microsoft fiscal Q2 2026; Salesforce Q4 FY2026 / Q1 FY2027 results; ServiceNow reporting); Agentforce and Data 360 ARR per Growth and Agentforce. Traction metrics are not comparably defined across vendors and are shown as reported.
The table mixes metrics that are not strictly comparable, and that is the finding: there is no agreed unit for "who is winning" in agents yet. But the direction is legible. Microsoft's advantage is that an agent is a feature it can switch on inside seats a customer already pays for; Salesforce's advantage is that the agent runs on the customer's own system of record and 92%-retained data, which is where an autonomous workflow has to reach to be useful. ServiceNow enters from workflow incumbency; the AI-native entrants enter with nothing to protect and therefore nothing to slow them down. Salesforce is a strong participant, not the runaway leader it is in CRM — and Wall Street has noticed the gap between the ARR growth rate and the depth of actual deployment, with more than one broker downgrading the stock in July 2026 on soft Agentforce adoption feedback.
The seat-based model under agentic AI
The bear case is not that a rival takes Salesforce's customers. It is that agents reduce how many seats those customers need. Salesforce's revenue is overwhelmingly per-user subscription; if a company can run its service desk or its sales operations with a handful of agents instead of scores of licensed employees, the seat count — and the bill — falls even with perfect retention.
For the first time, Salesforce's FY2026 10-K names this directly. Its list of competitors now includes "AI-native companies and emerging startups that leverage generative AI and large language models as the core foundation of their architecture, offering highly specialized, autonomous, or automated solutions that may bypass traditional business process workflows or displace established user interfaces" [2]. That clause did not appear in any of the four prior annual reports (FY2022–FY2025); it is new this year. The matching risk factor is equally plain: "New AI offerings may disrupt our service offerings or transform workforce needs and negatively impact demand for our offerings" [3]. "Transform workforce needs" is the seat-displacement mechanism, stated by the company whose seats are at issue.
The most direct evidence that the mechanism is real comes from Salesforce running the experiment on itself. Its own support portal, handling "over 60 million sessions and more than 2 million support cases yearly, all powered by Agentforce," has let the company "shift our workforce toward growth areas like distribution, where we strive to hire thousands of additional salespeople" [4]. Management frames this as the proof point, not the warning. Confronting "this strange narrative that's out there that somehow enterprise SaaS or apps or something are going away," Marc Benioff argued that a company can "do what we did, which is reduce your support heads and have an agentic layer and have a more efficient company and make more money and do better for your shareholders" [5].
Both readings sit inside that same fact. Salesforce cut its own support headcount because Agentforce works — and if it works for Salesforce, the same arithmetic lets Salesforce's customers cut the seats they buy from Salesforce. The company's answer is consumption pricing, which bills the agent's activity instead of the vanished seat (Growth and Agentforce); whether that recaptures the lost seat revenue dollar-for-dollar is the open variable, and it is the same variable the valuation chapter isolated as the line between a cheap price and a fair one (What the Price Implies). Isolated public examples cut against the company — Klarna's move to strip back packaged SaaS in favor of in-house agents drew Benioff's direct pushback — but they remain anecdotes, not a trend visible in the retention data.
The engine meant to replace displaced seats — pure Agentforce ARR of about $800M, roughly 2% of revenue once $1.1B of acquired Informatica is stripped out — is still a rounding error against the ~95% of $41.5B revenue that is per-seat, even as Salesforce's own 10-K newly names AI-native rivals that can 'displace established user interfaces' and Benioff proves the mechanism by cutting his own support heads. Those figures, and the ten-year scenario that turns on them, are developed in the growth and outlook chapters (Growth and Agentforce; Ten-Year Outlook).
Bull and bear on the same facts
Each row below is a fact both sides accept; the disagreement is what it implies and what would settle it.
Sources: FY2026 10-K Competition and Risk Factors [6][7]; Q2 FY2026 call [8]; IDC H2 2025 and company AI disclosures as reported.
The evidence does not settle this today, and pretending otherwise would be the error. What it does establish is a clean separation: in the incumbent CRM market the moat is not in question, and in the agentic market it is genuinely contested, with the structural distribution edge sitting with Microsoft and the data-and-workflow edge sitting with Salesforce. The reader's durability test — is year-ten free cash flow larger than today's — turns less on CRM share, which looks secure, than on whether the seat model survives its own automation.
What would change the read
Four checkable items, each with the line to watch and the threshold that flips it:
Net revenue retention on the AI line. Salesforce discloses Agentforce and Data 360 ARR but not a net revenue retention rate for it. A disclosed AI-line NRR holding above roughly 100% would show consumption revenue is replacing, not merely accompanying, seat revenue; its absence is why the seat question stays open.
Organic cRPO. Sustained organic current-RPO growth above the ~11–12% constant-currency mark named earlier (Growth and Agentforce) would signal the AI franchise is adding to the book faster than automation subtracts seats. Stuck near 9% leaves the seat question unresolved.
IDC CRM share through FY2027. Holding near 20% while agent-native entrants scale would confirm the incumbent market is not being routed around. A visible erosion — not seen yet — would be the first hard sign the category itself is shifting.
Reference-customer displacement. A large, named customer publicly replacing Salesforce seats with a rival or in-house agent stack at scale, in the manner Klarna has floated, would move the debate from anecdote to trend. The retention data shows no such trend to date [9].
What the Price Implies
At $170.77 (July 17, 2026), Salesforce's equity is worth about $140 billion and its enterprise value about $170 billion — roughly 11.8 times the $14.4 billion of free cash flow it produced in fiscal 2026, an 8.5% cash yield on enterprise value. Solved back through a simple perpetuity, that price is consistent with almost no long-run growth in free cash flow. The stock has fallen 54% from its December-2024 peak while free cash flow rose 52%; the entire move is multiple compression, not a decline in cash.
The price, the cash flow's real quality, and management's response to the sell-off tie together into one reading. The market prices Salesforce's free cash flow to grow near zero forever, but that cash flow is overstated by ~$3.5B of add-back stock compensation — leaving a ~7-8% true owner-yield — and management met the low price by borrowing $25B to repurchase stock at $198.34, above today's ~$171, levering a near-net-cash balance sheet to ~2.1x free cash flow.
The stakes sit at the thresholds a cash-focused buyer uses. Reported free cash flow yields 10.3% on equity and 8.5% on enterprise value, both above the 8% floor; the owner-yield of about 7.8%, after the stock-compensation add-back, is the one measure that falls just short of it — the line between a stock that clears the test and one that narrowly misses. The debt-funded buyback carries its own tension: net debt of roughly 2.1 times free cash flow sits inside a 2.0-2.5x tolerance, but only because the cash yield is high, so the leverage and the yield have to be weighed together rather than read apart. The March-2026 repurchase was the best-priced tranche of the program — $198.34 a share, about 22% below the $254.21 average paid across fiscal 2026 — yet borrowing to buy stock reallocated the capital structure more than it added value per share.
The earlier chapters established that the cash is real, durable, and lightly taxed by capital spending. This chapter is about the price paid for it.
What you pay
Share Price (17 Jul 2026)
Market Cap ($B)
Enterprise Value ($B)
FCF Yield (on market cap)
Forward P/E (FY2027E)
Drawdown from Dec-2024 peak
Sources: share price and consensus as reported (market data); ~819 million shares outstanding [1]; $39.3B carrying debt [2] less $8.9B cash [3]; FY2026 free cash flow derived from operating cash flow of $15.0B less capex [4].
The equity market capitalization is smaller than a stale share count implies. After the March-2026 accelerated repurchase settled, Salesforce carried about 819 million shares [5], so at $170.77 the equity is worth roughly $140 billion, not the ~$158 billion a pre-buyback count would suggest. Enterprise value is the cleaner anchor here, because that repurchase was debt-funded: it swapped equity for about $30 billion of net debt rather than changing what the whole business costs. Total debt of $39.3 billion [6] against $8.9 billion of cash and $2.9 billion of marketable securities [7] puts net debt near $30 billion and enterprise value near $170 billion whether you measure it just before or just after the buyback. The debt profile and the leverage math sit in Cash Quality.
On that $170 billion, fiscal-2026 free cash flow of $14.4 billion is an 8.5% yield; on the $140 billion of equity it is a 10.3% yield. Both clear the 8% threshold a cash-focused buyer looks for, and the equity figure reaches 10%. The qualifier established earlier still applies: about $3.5 billion of that free cash flow is stock-based compensation the cash-flow statement adds back [8], so on an owner-earnings basis the yield is nearer 7.8% (Cash Quality).
Price down, cash up
Source: FY2026 Annual Report (Form 10-K), derived from operating cash flow less capital expenditures, FY2022–FY2026 [9].
The de-rating is easy to misread as a business in trouble. It is not what the cash flows say. Free cash flow has risen every year for a decade and grew 52% between fiscal 2024 and fiscal 2026, from $9.5 billion to $14.4 billion. Over almost exactly that window the share price fell from $367.87 to $170.77. What changed was the multiple the market was willing to pay, which compressed from roughly 28 times trailing free cash flow at the December-2024 peak to under 10 times today.
Sources: share price as reported (market data); trailing free cash flow from FY2025 and FY2026 filings [10]; Price/FCF derived.
For a value buyer who hunts selloffs where the hit to market value outruns the hit to the cash flows, this is the setup in its purest form: the market value fell while the cash flow it was buying grew. Whether that gap is opportunity or a correct re-rating of a maturing franchise is the question the rest of this chapter works through.
What the price implies for growth
The clearest way to read $170.77 is to ask what rate of future cash growth it embeds. Discounting the current free cash flow as a growing perpetuity and solving for the growth rate isolates the rate the price already assumes. At a 10% discount rate, the equity value of about $140 billion is consistent with reported free cash flow growing roughly 0% forever, and, once the stock-based-compensation add-back is stripped out, with owner free cash flow growing about 2% forever.
Source: derived — single-stage Gordon growth on FY2026 free cash flow of $14.4B (and $10.9B after deducting $3.5B stock-based compensation) against the ~$140B equity value; illustrative, assuming a flat perpetual growth rate rather than an explicit forecast period.
Across a reasonable band of discount rates, the number lands in the same place: the market is pricing Salesforce as a near-zero-growth cash cow. That is a demanding assumption to defend against the rest of the record. Free cash flow compounded at roughly 27% a year for a decade; revenue still grew 9.6% in fiscal 2026; the retention floor documented in Switching Costs is near 92%; and $72.4 billion of remaining performance obligation — about 1.7 times annual revenue — is already under contract [11]. A business does not have to re-accelerate to beat a 0% bar; it only has to avoid shrinking.
Two caveats keep this from being a one-way argument. The perpetuity is a simplification — a genuine two-stage model with a decade of high-single-digit growth followed by a fade would justify a higher price, so the near-zero implied rate is the floor of what the market expects, not a claim that it expects decline. And the refinancing raises the cost of the equity claim: pro-forma interest of roughly $1.8 billion, against $0.3 billion in fiscal 2026 (Cash Quality), trims free cash flow to equity by a bit over $1 billion after tax, which nudges the implied-growth bar up by well under a percentage point. Neither changes the shape of the result.
At $170.77, a 10% discount rate implies the market expects Salesforce's free cash flow to be roughly flat in perpetuity — for a company whose free cash flow has risen every year for ten years and that is guiding to 10% revenue growth through fiscal 2030.
The multiple in context
The same picture holds on the multiples an equity buyer watches. Forward earnings estimates put the stock at about 12 times fiscal-2027 consensus EPS of $14.13 and 11 times the fiscal-2028 figure of $15.53 — low for a franchise that spent most of the last decade above 30 times earnings. Consensus among the roughly 50 analysts covering the stock carries a mean price target of $245 and a median of $238, against $171 today; the low estimate sits at $160 and the high at $475, a spread that itself says the debate is unresolved.
Sources: free cash flow and operating income from the FY2026 10-K [12] [13]; net debt from the Q1 FY2027 10-Q [14]; forward P/E from consensus estimates; ratios derived.
The one yardstick Salesforce does not clear is EV/EBITDA: at about 18 times GAAP EBITDA — roughly 13 times if you add back stock-based compensation as software buyers often do — it is well above the sub-12x level a value investor uses as a screen for monopolies. For a company this capital-light, where depreciation is small and cash conversion is the whole point, free-cash-flow yield is the more faithful lens than EBITDA, and on that lens the stock passes. But an investor who insists on EV/EBITDA below 12 does not get there here, and that should be said plainly.
The bull and bear cases
The reader arriving cold wants the short version: what is the business, what went wrong, and why might it be interesting now. The business is the subscription CRM cash machine of The Cash Machine — one segment, 95% recurring revenue, $14.4 billion of free cash flow, a 92% retention floor, and $72.4 billion of contracted backlog.
What went wrong is a story of expectations, not cash. At the December-2024 peak the market paid nearly 28 times free cash flow, a multiple that assumed the mid-20s growth of fiscal 2022 would persist and that Agentforce would monetize quickly. Instead revenue growth settled at 9.6%, the AI-and-data franchise reached only about 7% of revenue (Growth and Agentforce), and management borrowed $25 billion to buy back stock at an average $198.34 [15] — above today's price — after repurchasing $12.7 billion in fiscal 2026 at an average $254.21 [16]. The multiple corrected from a growth rating to a value rating.
Why it might be interesting is that the correction has gone further than the cash flows. The market now prices roughly no growth into a business that grew free cash flow 52% over two years, retains its customers at 92%, has 1.7 years of revenue under contract, and yields 8-10% in cash. On the reader's own tests it screens well on free-cash-flow yield and on the fear-driven-selloff signal, and its net leverage of about 2.1 times free cash flow sits inside the tolerance a high-yield business earns.
The bear's answer is specific and cannot be dismissed. If agentic AI genuinely compresses the seat-based software model, growth does not merely decelerate — it inverts, and a price that implies 0% perpetual growth is not cheap but correct. The consumption-pricing pivot meant to offset that risk is, by management's own account, new and hard to forecast (Growth and Agentforce). Stock-based compensation lowers the true yield to 7.8%; the ASR spent real cash above the current price; and the higher post-2026 interest bill is permanent.
The evidence points one way more than the other: the de-rating has outrun the deterioration in cash flows, and at under 10 times free cash flow the price embeds a pessimism that the retention floor and contracted backlog do not yet justify. The fact that most weakens that read is the one the bear names — a durable move of enterprise budgets away from per-seat software toward AI agents Salesforce does not capture. What would settle it is observable: organic current remaining performance obligation holding above 11-12% in constant currency would confirm re-acceleration and support a re-rating, while a slide toward zero would validate the multiple the market has already assigned.
One question this chapter cannot close from the filings is the reader's universe test — the liquidity and implied volatility of the longest-dated at-the-money options. That requires an options-chain source outside the corpus; realized 30-day volatility of about 38% (near the middle of the stock's own five-year range) is the only volatility read the corpus supports, and it is a backward-looking proxy, not the implied figure the test asks for.
For its first decade as a public company Salesforce bought growth: roughly $50 billion of goodwill from Tableau, Slack, MuleSoft and Informatica. Through FY2022 that capital earned close to nothing — about a 1% return on invested capital. The FY2024 margin reset lifted the figure to near 10%, roughly its cost of capital, and management turned the cash machine toward buybacks and a dividend. FY2026 did both at once, funded by $25 billion of new debt.
Two machines
Salesforce has run two capital-allocation regimes back to back. From FY2017 to FY2022 it was a serial acquirer, converting cash and its own shares into scale. Goodwill on the balance sheet grew from $7.3 billion to $57.9 billion — a $50.6 billion pile of premium paid over the net tangible assets of the companies it absorbed [1]. Four deals account for most of it.
Source: Salesforce balance sheets, FY2017–FY2026; step-ups from MuleSoft (FY2019), Tableau (FY2020), Slack (FY2022) and Informatica (FY2026) [2].
The headline transactions set the scale of the ambition. Tableau closed in 2019 for $15.7 billion, paid entirely in stock, and brought $10.9 billion of goodwill [3]. Slack closed in July 2021 for $27.1 billion — $15.8 billion in cash and $11.1 billion in stock — the largest deal in the company's history and $21.4 billion of it goodwill [4]. Informatica followed in FY2026 at $9.6 billion, almost all cash [5].
Sources: Tableau prospectus [6]; Vlocity and Acumen [7]; Slack [8]; Regrello [9] and Informatica [10].
The $85 billion figure often attached to Salesforce's dealmaking is a lifetime headline that also captures earlier purchases — ExactTarget, Demandware, MuleSoft. The cleaner measure of what the buying cost is the goodwill still carried today: $57.9 billion, or 52% of total assets, none of it deductible for tax and none of it ever written down. That last point cuts two ways, and the return math is where it resolves.
What the acquisitions earned
The honest test for a serial acquirer is return on invested capital measured with goodwill in the base — because the goodwill is the price paid, and a buyer only creates value if the acquired earnings clear the cost of the capital sunk into them. On that basis the picture is a straight line up.
Source: derived from Salesforce consolidated financials, FY2022–FY2026 — NOPAT (operating income less cash taxes) over stockholders' equity plus debt less cash; FY2026 operating income $8.3B [11], invested capital ~$66B [12].
Through FY2022 the returns were roughly 1%. On the capital the market could see, the acquisitions had built a much larger company that generated almost no economic profit — the criticism that drew activist investors to the register in early 2023. What changed was not the deals but the cost base: FY2026 operating income of $8.3 billion is fifteen times the $0.55 billion of FY2022 [13], while invested capital barely moved. That lifted goodwill-inclusive ROIC to about 10% — close to the 10% discount rate the reverse-DCF in What the Price Implies applies.
The read this supports: the acquisitions now roughly earn their keep, but only just, and only because of the margin reset. Two facts sit against a stronger conclusion. First, the return sits at the cost of capital, not comfortably above it — collectively the $50 billion of goodwill has yet to prove it compounds value rather than merely preserving it. Second, the calculation is conservative in Salesforce's favour: it counts only cash as excess, so including the marketable-securities balance would shrink invested capital and lift the return by a point or two. The absence of any goodwill impairment across a decade is consistent with acquisitions that pull their weight; it is also what a company under no accounting pressure to admit an overpayment would report. The read is most sensitive to whether the margin reset holds, which connects directly to the growth question in Growth and Agentforce: the returns stay near 10% only while the operating leverage of the last three years persists.
The pivot to returns
The clearest signal of how management now reads its own opportunity set is where the cash goes. Having spent a decade buying companies, Salesforce began in FY2023 to buy its own stock, and in FY2025 initiated a dividend.
Source: Salesforce consolidated statements of cash flows, FY2023–FY2026, as reported.
Across FY2023–FY2026 the company returned about $35 billion — roughly $32 billion of buybacks and $3 billion of dividends — against $42.6 billion of cumulative free cash flow, or about 83% of what it generated. The buyback authorization was lifted repeatedly, from $10 billion at inception in August 2022 to a $50 billion total by February 2026 [14]. The dividend, first paid in April 2024 at $0.40 a quarter, was raised to $0.416 through FY2026 and then to $0.44 [15]. For an investor who treats buybacks as evidence of discipline, the size is settled; the read is most sensitive to the price paid.
On price, the record is mixed. The repurchases have been programmatic rather than opportunistic, and much of the earlier volume was bought at prices the stock has since fallen below.
Sources: FY2026 Q1 open-market at $273.42, ASR initial delivery of 103M shares at $198.34, and FY2027 Q1 open-market at $192.00 [16]; FY2026 average $254.21 as established in The Cash Machine; recent quote ~$171 per What the Price Implies.
Every tranche shown was bought above the recent ~$171 quote, including the cheapest. That is the fair charge against the buyback: it has shrunk the share count but has not, so far, been timed to the lows. The countervailing fact is the March 2026 accelerated share repurchase. Salesforce committed $25 billion — half the entire authorization — in a single stroke, taking initial delivery of about 103 million shares at $198.34, funded not from cash but from $25 billion of new senior notes maturing between 2028 and 2066 [17], [18]. Coming after the stock had de-rated by more than half from its December 2024 peak, this was a leveraged bet on the company's own undervaluation — the balance-sheet transformation examined in Cash Quality, read here as a capital-allocation choice. It moved Salesforce from a near-net-cash position to roughly 2x net debt to free cash flow. How that judgment reads is most sensitive to the stock price, which has since fallen a further 14% below the ASR's own average price.
Informatica and the discipline question
The tidy story — acquirer becomes disciplined capital returner — is complicated by FY2026, when Salesforce did everything at once. Alongside the record $12.6 billion of buybacks and the first dividend increase, it closed the $9.6 billion Informatica purchase and the smaller Regrello deal, and it did so on borrowed money: a $4 billion and a $2 billion credit facility taken in June 2025 to finance Informatica, later refinanced into a $6 billion five-year term loan [19].
Informatica is the clearest read on whether the post-2023 restraint is a permanent change in temperament or a pause. It is the first large, debt-financed acquisition since Slack, struck by a management team that spent two years telling investors it had learned to prize profitability over scale. The deal is defensible on strategy — data management feeds directly into the Data 360 franchise that anchors the AI case in Growth and Agentforce — but it lands on the same balance sheet already carrying $50 billion of not-yet-proven goodwill, and it was funded with debt at a moment when the company was also borrowing $25 billion to buy back stock. The reader learns more about management's true priorities from watching whether Informatica is the last big deal or the first of a new wave than from any statement on a call.
What would change the read
Three things would move this assessment. Goodwill-inclusive ROIC drifting back above 11–12% would confirm the acquisitions compound value rather than merely cover their cost; a slip back toward the mid-single digits, most likely through margin give-back, would revive the pre-2023 verdict that the buying built size without economic profit. A goodwill impairment — absent for a decade — would be the first accounting admission that a price was too high. And a second Informatica-scale, debt-funded deal within the next year or two would signal that the discipline of FY2023–FY2025 was cyclical, not structural. For now the record reads as a company that overpaid for growth, was forced to make it pay, and has since chosen its own shares over further empire-building — with the March 2026 debt-funded repurchase as the boldest, and least reversible, expression of that choice.
Ten-Year Outlook
This report set out to test whether the cash Salesforce generates a decade from now will be reliably larger than the roughly $14 billion it produces today. The evidence supports a yes: year-ten revenue is very likely higher than today's $41.5 billion, and free cash flow with a little more room, because a ~92% revenue-retention floor, $72.4 billion of contracted revenue, and a base no single customer dominates make a sustained decade-long revenue decline the minority outcome. The case is most sensitive to one variable — whether AI agents erode the per-seat base faster than usage pricing recaptures it. The engine meant to replace displaced seats — pure Agentforce ARR of about $800M, roughly 2% of revenue once $1.1B of acquired Informatica is stripped out — is still a rounding error against the ~95% of $41.5B revenue that is per-seat, even as Salesforce's own 10-K newly names AI-native rivals that can 'displace established user interfaces' and Benioff proves the mechanism by cutting his own support heads. [1][2][3]
The gap the durability case must eventually close is wide. Pure Agentforce ARR of about $800 million is roughly 2% of revenue, while the per-seat base it would have to defend is about 95% of $41.5 billion — some $39.4 billion, a gap of roughly fifty times. The counter sits in the same figures: that $800 million grew 169% year over year [4], 362 customers "refilled the tank" on Agentforce usage in Q3 FY2026 against three a year earlier [5], and the company closed 16 multi-year "Agentic Enterprise License Agreements" in the quarter [6] — so a base compounding at triple digits could reach materiality in two to three years. The one number that would settle the direction is not published: net dollar retention on the Agentforce and Data 360 line is undisclosed, so whether usage revenue is replacing lost seats or merely adding to them cannot yet be read from outside. In the scenario table below, only the Displacement path — where recapture treads water against seat erosion — matches today's ~$170 share price (What the Price Implies).
Revenue, FY2026 ($B)
Free Cash Flow, FY2026 ($B)
Contracted RPO ($B)
Revenue Attrition
Sources: FY2026 Form 10-K, MD and A key metrics (revenue, RPO) [7]; Q3 FY2026 earnings call (attrition ~8%) [8].
The base under the question
Whether revenue in year ten clears today's level is, at bottom, a question about net dollar retention held over a long horizon, and three facts already established in this report set the floor.
First, the retention floor. Revenue attrition has sat near 8% for four straight years, through a demand slowdown, a restructuring, price increases and the AI transition (Switching Costs), and Q3 FY2026 confirmed it ended "at approximately 8%" again [9]. Roughly 92% of contract value is retained each year before a single new seat is sold. Second, the contracted book. Remaining performance obligation stood at $72.4 billion at January 2026, up 14%, with $35.1 billion of it recognizable inside twelve months [10] — about 1.7 times a year's revenue already under signature. Third, diversification: no customer is more than 10% of revenue [11], so the decline path runs through tens of thousands of independent renewal decisions, not one.
The honest counterweight sits in the same arithmetic. A 92% gross-retention rate compounds against you if net expansion ever stops: with no new logos and no upsell, 0.92 to the tenth power leaves 43% of today's revenue. Revenue has grown every year only because expansion and new business have added far more than churn subtracts. The mechanism most likely to flip net retention below 100% — customers automating work and buying fewer seats — is real and newly disclosed by the company itself: the FY2026 10-K warns that new AI offerings "may… transform workforce needs and negatively impact demand," and calls the offsetting consumption model "relatively new and uncertain" [12]. That is the risk the recapture engine described in this chapter's opener must eventually offset (Growth and Agentforce).
Three ways the decade plays out
The scenarios below carry one variable forward — whether Agentforce-style usage revenue outruns, matches, or trails the seat erosion its own technology enables. Each path starts from FY2026 revenue and runs ten years; free cash flow is scaled at roughly the ~35% FCF margin the business earns today (Cash Quality), less the incremental interest on the March-2026 debt in the weaker cases.
Source: illustrative paths derived from FY2026 revenue of $41.5 billion [13] compounded at the CAGRs in the table below; not company projections.
Sources: scenario CAGRs applied to FY2026 revenue [14]; FY2030 $60B+ / 10%-organic-CAGR target from the October 2025 Investor Day [15]; FY2028E from the consensus estimates feed.
Three of the four paths end above today's revenue; only the severe-decline tail ends below it, and it requires the displacement mechanism to run unchecked for a decade against a book that renews at 92% and $35 billion of revenue already contracted for the next year. That asymmetry is the substance of the answer: a sustained decade-long decline is the minority outcome, not the base case. Management's own bet sits at the top of the range — a $60 billion-plus FY2030 target implying a 10%-plus organic CAGR, and a "50 by FY30" framework tying subscription growth plus margin to a fixed sum [16] — while Q3 FY2026 gave the first mechanical evidence it might be more than a slide: 362 customers "refilled the tank" on Agentforce usage in one quarter, up from three a year earlier [17], with the company reiterating it is "on track to reaccelerate revenue… in twelve to eighteen months" [18]. Free cash flow is the higher-confidence line of the two: it has risen every year for a decade, capex runs near 1.4% of revenue [19], and even the displacement path leaves cash roughly flat rather than falling, because operating leverage and the capex-light model cushion a slower top line — the offset is the incremental interest on the $25 billion of senior notes issued in March 2026 to fund the accelerated buyback [20] (Capital Allocation).
Reconciling the scenarios with the price
The value in the setup is that the market is priced closer to the bear path than the base. At about $170 the enterprise is worth roughly $170 billion, near 11.8 times FY2026 free cash flow, which discounts to something close to 0% perpetual FCF growth (What the Price Implies). Hold today's ~11.8x multiple and the Fade scenario alone — mid-single-digit growth, no re-acceleration — implies FCF near $25 billion and an enterprise value approaching $290 billion a decade out. Only the Displacement path, where usage revenue merely treads water against seat erosion, roughly justifies the current price. The market-value hit has outrun any deterioration visible in the contracted book or the retention rate, and the price now embeds an outcome the durability evidence puts in the minority.
That is a reconciliation, not a recommendation. The same facts support a fair-value reading if you believe agentic automation inverts rather than decelerates seat-based software — in which case a maturing franchise priced for no growth is priced correctly, and the recapture line never scales. The evidence does not settle that; it locates where the disagreement lives.
What would move the read
The read is falsifiable, and the signals that would raise or lower it are specific, checkable line items rather than sentiment. The most informative disclosure still missing — net revenue retention on the Agentforce and Data 360 line — is not yet published; its absence is why the recapture question stays open.
Sources: attrition and RPO, FY2026 10-K and Q3 FY2026 call [21][22]; Agentforce ARR mix, 2026 proxy [23]; consumption-model uncertainty, FY2026 10-K risk factors [24].
Catalysts, base rates, and universe fit
The next scheduled read is the Q2 FY2027 print on 2 September 2026, where consensus looks for about $11.3 billion of revenue and $3.27 in non-GAAP EPS. The base rates say the swing at that print is not the earnings number. Salesforce has beaten EPS estimates for eight straight quarters, the last three by double digits, yet the shares de-rated more than 50% over the same window — the market is trading the company on current RPO and the re-acceleration timeline, not on margin beats.
Source: reported results versus consensus, per the earnings estimates feed.
Sentiment is constructive but split: about 40 of 52 covering analysts rate the stock buy or better, the mean price target is roughly $245 against a $170 quote, and the range runs from $160 to $475 — a spread that is itself the bull-bear disagreement priced into one tape. Reported short interest is not published in this dataset, so crowding cannot be sized here.
Salesforce is a deeply traded US mega-cap with listed, long-dated options — LEAPS currently extend to January 2028, well beyond a one-year horizon — so it is investable through the long-dated options a multi-year view requires. The term structure that would let an investor act on it — at-the-money implied volatility, open interest and bid-ask depth on the longest-dated strikes, against the realized volatility of the price series — is developed in Options and Volatility.
Options and Volatility
This chapter answers the reader's standing options question and the hard universe screen behind it. Salesforce clears the screen with room to spare: liquid, at-the-money options extend to December 2028, roughly two and a half years out, against a stock that trades about $2.4 billion a day. At-the-money implied volatility sits near 47–48% across the 30-, 90-, and 180-day terms — a modest premium to the calmer 30-day realized vol, but close to the top of the stock's own one-year realized range.
The universe screen
The reader excludes anything without liquid, at-the-money, long-dated options — preferably beyond one year. Salesforce is on the deep end of that test rather than the margin of it. Standard annual LEAPS run to 21 January 2028 (about 549 days out as of late July 2026), and a December 2028 series extends the chain to roughly 878 days — about two and a half years of listed optionality. Nearer LEAPS anchor the ladder in June, September, and December 2027.
Source: third-party listed-options data (stockoptionschannel.com), CRM option chain, as of 21 July 2026.
The instruments are not just listed; they are used. Open interest runs to roughly 295,000 call contracts and 313,000 put contracts, close to their trailing 52-week averages near 279,000 each — on the order of 600,000 contracts, or about 60 million share-equivalents, held open. The underlying itself is among the most liquid securities an institution can trade: the data feed classifies it as "deep institutional liquidity," with about 15 million shares and $2.4 billion of value changing hands per session and a full exit of a 1%-of-market-cap position modelled in roughly five days.
Longest Listed Option (days)
Total Open Interest (contracts)
Underlying ADV ($)
Sources: listed-options data (stockoptionschannel.com, marketchameleon.com) as of 21 July 2026; underlying liquidity from the price/volume data feed, as reported (20-day ADV to 17 Jul 2026).
The screen is not close on any axis. The universe exclusion [unv-00008] is designed to screen out illiquid or short-dated names; Salesforce fails to trip it on every axis — duration, options open interest, and underlying depth alike.
Implied volatility and its term structure
The second half of the question is price: what the options market charges for that duration. At-the-money implied volatility clusters near 47–48% across the curve — 47.1% at 30 days, 48.3% at 90 days, 47.8% at 180 days. The term structure is close to flat, so a buyer of long-dated optionality is not paying a steep premium over near-dated vol for the extra calendar time.
Sources: implied volatility (mean of calls and puts) and close-to-close historical volatility from third-party options statistics (alphaquery.com), as of 20 July 2026.
The relationship between implied and realized volatility is where the nuance sits. Against the calmer 30-day trailing realized vol of about 37.5%, the 30-day implied of 47.1% carries roughly a ten-point premium — the ordinary variance-risk premium plus some allowance for the 2 September 2026 print. But over 90 and 180 days the trailing realized vol is itself elevated — 49.3% and 45.8% — because those windows already contain the sharp AI-driven repricing this report documents elsewhere. On those horizons implied volatility is roughly in line with, not above, what the stock has actually delivered. The options market is pricing forward volatility at close to the pace the shares have recently moved.
The downside is not being singled out. The ratio of put to call implied volatility is about 1.01 and the volatility skew is near zero, so the market is not charging a fear premium for crash protection the way it would for a name investors expected to gap down. Positioning leans the other way: open interest is call-heavy, with a put/call open-interest ratio near 0.63.
What the volatility level implies
Placed against the stock's own history, 47–48% is not a cheap volatility regime. Over the trailing year, realized 30-day vol has ranged from about 18% to 58%, with a median near 36% and an 80th-percentile band at roughly 46%. Current implied volatility therefore sits close to the top of the range the shares have actually printed — the level you would expect after a de-rating of more than 50% from the December 2024 peak (What the Price Implies) rather than during the quiet years that preceded it.
30-Day Implied Vol
30-Day Realized Vol
1-Yr Realized Vol, 80th %ile
Sources: implied vol from third-party options statistics (alphaquery.com, 20 Jul 2026); realized-vol level and one-year percentile bands from the price/volume data feed, as reported (to 17 Jul 2026).
That level is the practical consequence for anyone weighing this name on the reader's terms. The report's central question is whether the cash Salesforce throws off a decade out is reliably larger than today's (Ten-Year Outlook) — a multi-year view, and the December 2028 chain is long enough to hold one. The cost of holding it is set by a ~48% implied vol that sits near the high end of the stock's realized range, embedding the same AI-transition uncertainty the rest of this report anatomizes. Salesforce's own FY2026 10-K frames the reason plainly: its stock price "has been and is likely to continue to be subject to wide fluctuations," driven in part by "investor sentiment regarding AI-related business models" [1]. The options market has repriced that uncertainty into a higher volatility, and long-dated premium reflects it.
The universe screen is settled: Salesforce offers liquid, at-the-money options out to December 2028, so it clears the reader's longest-dated-optionality exclusion. The price of that optionality — implied vol near 47–48% — sits toward the top of the stock's one-year realized-vol range, not the bottom.
Limitations
The options figures here come from third-party market aggregators as of 20–21 July 2026, not from the filing corpus, and they move continuously; treat the exact decimals as a snapshot rather than a fixed fact. Precise at-the-money bid-ask spreads and per-strike open interest on the specific December 2028 contracts were not independently confirmed at the level of a live broker chain, so the depth claim rests on aggregate options open interest and the underlying's liquidity rather than a quote-by-quote book. The realized-volatility series and the underlying-liquidity metrics are from the run's price/volume data feed. This chapter characterizes the options market and the volatility regime; it is not trade advice.